Download
1 / 28
280 likes | 375 Views
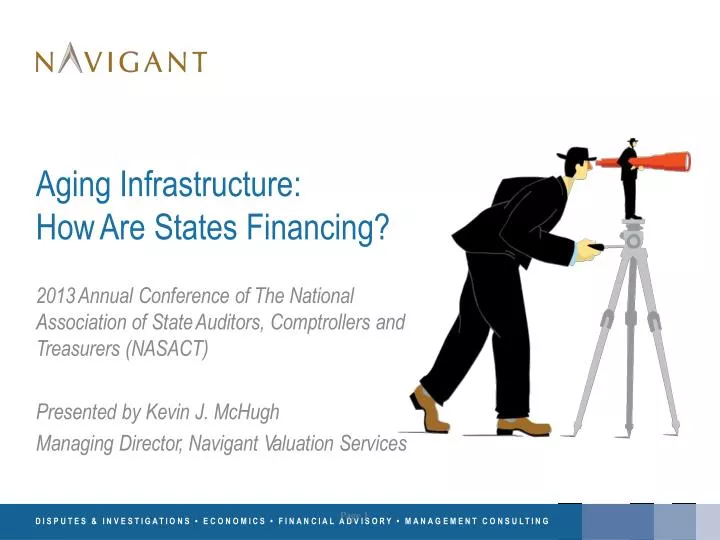
Aging I n f ras t ruc t ure: How Are S t a t es F inanc i n g ?. 2 01 3 An n u a l Con f e r e n ce o f Th e Na t i o n a l A ss o c ia t io n o f S t a te Aud i t o rs, Co m p tr olle rs a nd T r e a s u r e rs ( NASAC T) P r e s e n t e d b y Ke vin J. Mc Hug h

E N D
AgingInfrastructure: HowAreStatesFinancing? 2013AnnualConferenceofThe National AssociationofStateAuditors,ComptrollersandTreasurers(NASACT) PresentedbyKevinJ. McHugh ManagingDirector,NavigantValuationServices DISPUTES&INVESTIGATIONS•ECONOMICS•FINANCIALADVISORY•MANAGEMENTCONSULTING DISPUTES&INVESTIGATIONS•ECONOMICS•FINANCIALADVISORY•MANAGEMENTCONSULTING
InfrastructureinAmerica–WhereDo WeStand? » Weare ata pivotalmomentwhenitcomestomaintainingand modernizingournation’sinfrastructure.Manyofourroadsbridges, watersystemas wellas ournationalelectricgridwereputintoplace over50yearsagoandallofthesesystemsare simplyoverwhelmedor wornout. » TheAmericanSocietyofCivilEngineers(ASCE)2013ReportCardfor America’sinfrastructuregivesanoverallgradeofD+across16major categoriesofinfrastructure.Thiswasa slightincreaseto the2009 ReportCarddueto eitheranincreaseinprivateinvestment,targeted efforts incitiesandstatestomakeupgradesorrepairs,orfrom anone time boostinfederalfunding.
InfrastructureinAmerica–WhereDo WeStand? » As afoundationto thispresentation,let’sreviewwhereweare withour nation’sprimaryinfrastructureassets.Clearly,notapretty picture,but thefactsandsignificanceare overwhelmingandsimplycannotbe ignoredatrisk toournation’sfuture andthesafetyofourcitizens.
AnOverviewofOurCurrentAging InfrastructurebyCategory » Dams1: Theaverageageofthe84,000damsinthecountryis 52 yearsold. Thenation’sdamsareagingandthenumberofhigh-hazard damsis ontherise.Manyofthesedamswerebuiltaslow-hazard damsprotectingundevelopedagriculturalland.However,withan increasingpopulationandgreaterdevelopmentbelowdams,the overallnumberofhigh-hazarddamscontinuestoincrease,to nearly 14,000in2012. Thenumberofdeficientdamsiscurrentlymore than 4,000. TheAssociationofStateDamSafetyOfficialsestimatesthatit willrequireaninvestmentof$21billionto repairtheseaging,yet critical,high-hazarddams.– GradeD 1 StatisticsprovidedbyASCE
AnOverviewofOurCurrentAging InfrastructurebyCategory » DrinkingWater1: Muchofourdrinkingwaterinfrastructureisnearing theendofitsusefullife.Thereareanestimated240,000watermain breaksperyearintheUnitedStates.Assumingeverypipewouldneed to bereplaced,thecostoverthecomingdecadescouldreachmore than$1trillion,accordingto theAmericanWaterWorksAssociation (AWWA).–GradeD 1 StatisticsprovidedbyASCE
AnOverviewofOurCurrentAging InfrastructurebyCategory » HazardousWaste1: Therehasbeenundeniablesuccessinthe cleanupofthenation’shazardouswasteandbrownfieldssites. However,annualfundingfor Superfundsitecleanupisestimatedtobe asmuchas $500millionshortofwhatisneeded,and1,280sites remainontheNationalPrioritiesListwithanunknownnumberof potentialsitesyetto beidentified.More than400,000brownfieldssites awaitcleanupandredevelopment.–GradeD 1 StatisticsprovidedbyASCE
AnOverviewofOurCurrentAging InfrastructurebyCategory » Levees1:Thenation’sestimated100,000milesofleveescanbefound inall50statesandtheDistrictofColumbia.Many oftheseleveeswere originallyusedto protectfarmland,andnowareincreasinglyprotecting developedcommunities.Thereliabilityoftheseleveesis unknownin manycases,andthecountryhasyetto establishaNationalLevee SafetyProgram.Publicsafetyremainsatrisk fromtheseaging structures,anthecostto repairorrehabilitatetheseleveesisroughly estimatedtobe$100billionbytheNationalCommitteeonLevee Safety.–GradeD- 1 StatisticsprovidedbyASCE
AnOverviewofOurCurrentAging InfrastructurebyCategory » Wastewater1: Capitalinvestmentneedsforthenation’swastewater andstormwatersystemsare estimatedto total$298billionoverthe next20years.Pipesrepresentthelargestcapitalneed,comprising threequartersoftotalneeds.Fixingandexpandingthepipeswill addresssanitaryseweroverflows,combinedseweroverflows,and otherpipe-relatedissues.Since2007,thefederalgovernmenthas requiredcitiesto investmore than$15billioninnewpipes,plants,and equipmentto eliminatecombinedseweroverflows.–GradeD 1 StatisticsprovidedbyASCE
AnOverviewofOurCurrentAging InfrastructurebyCategory » Bridges1: Overtwohundredmilliontrips are takendailyacross deficientbridgesinthenation’s102largestmetropolitanregions.In total,oneinnineofthenation’sbridgesare ratedasstructurally deficient,whiletheaverageageofthenation’s607,380bridgesis currently42years.TheFederalHighwayAdministration(FHWA) estimatesthatto eliminatethenation’sbridgebacklogby2028,we wouldneedto invest$20.5billionannually,whileonly$12.8billionis beingspentcurrently.Thechallengeforfederal,state,andlocal governmentsis toincreasebridgeinvestmentsby $8billionannuallyto addresstheidentified$76billioninneedsfor deficientbridgesacross theUnitedStates.–GradeC+ 1 StatisticsprovidedbyASCE
AnOverviewofOurCurrentAging InfrastructurebyCategory » InlandWaterways1: Ournation’sinlandwaterwaysandrivers are the hiddenbackboneofourfreightnetwork– theycarrytheequivalentof about51milliontruck trips eachyear.In manycases,theinland waterwayssystemhasnotbeenupdatedsincethe1950s,andmore thanhalfofthelocksareover50yearsold.Bargesarestoppedfor hourseachdaywithunscheduleddelays,preventinggoodsfrom gettingto marketanddrivingupcosts.Thereisanaverageof52 serviceinterruptionsa daythroughoutthesystem.Projectsto repair andreplaceaginglocksanddredgechannelstakedecadestoapprove andcomplete,exacerbatingtheproblemfurther.Conditionsremain poorandinvestmentlevelsremainstagnant.–Grade D- 1 StatisticsprovidedbyASCE
AnOverviewofOurCurrentAging InfrastructurebyCategory » Ports1: TheU.S.ArmyCorpsofEngineersestimatesthatmore than 95%(by volume)ofoverseastradeproducedorconsumedbythe UnitedStatesmovesthroughourports.To sustainandservea growingeconomyandcompeteinternationally,ournation’sports need to bemaintained,modernized,andexpanded.Whileportauthorities andtheirprivatesectorpartnershaveplannedover$46billionin capitalimprovementsfrom nowuntil2016,federalfundinghas declinedfornavigablewaterwaysandlandsidefreightconnections neededto movegoodsto andfromtheports.–GradeC 1 StatisticsprovidedbyASCE
AnOverviewofOurCurrentAging InfrastructurebyCategory » Rail1: Railroadsareexperiencinga competitiveresurgenceasboth anenergy-efficientfreighttransportationoptionandaviablecity-to-city passengerservice.In 2012,Amtrakrecordeditshighestyearof ridershipwith31.2millionpassengers,almostdoublingridershipsince 2000,withgrowthanticipatedtocontinue.Bothfreightandpassenger railhavebeeninvestingheavilyintheirtracks,bridges,andtunnelsas wellasaddingnewcapacityforfreightandpassengers.In 2010alone, freightrailroadsrenewedtherailsonmore than3,100milesofrailroad track,equivalentto goingcoastto coast.Withhighridershipand greaterinvestmentinthesystem,thegradeforrailwitnessedthe largestimprovement,mainlywithintheNortheastcorridor.–Grade C+ 1 StatisticsprovidedbyASCE
AnOverviewofOurCurrentAging InfrastructurebyCategory » Roads1:Forty-two percentofAmerica’smajorurbanhighwaysremain congested,costingtheeconomyanestimated$101billioninwasted time andfuelannually.Whiletheconditionshaveimprovedinthenear term, andfederal,state,andlocalcapitalinvestmentsincreasedto $91 billionannually,thatlevelofinvestmentisinsufficientandstillprojected to resultinadeclineinconditionsandperformanceinthelongterm. Currently,theFederalHighwayAdministrationestimatesthat$170 billionincapitalinvestmentwouldbeneededonanannualbasisto significantlyimproveconditionsandperformance.–Grade D 1 StatisticsprovidedbyASCE
AnOverviewofOurCurrentAging InfrastructurebyCategory » PublicParksandRecreation1: Thepopularityofparksandoutdoor recreationareasintheUnitedStatescontinuesto grow,withover140 millionAmericansmakinguseofthesefacilitiesapartoftheirdaily lives. Theseactivitiescontribute$646billionto thenation’seconomy, supporting6.1millionjobs.Yetstatesandlocalitiesstruggletoprovide thesebenefitsfor parksamidflatanddecliningbudgets,reportingan estimated$18.5billioninunmetneedsin2011.Thefederal governmentis alsofacinga seriouschallengeaswellsincethe NationalPark Serviceestimatesitsmaintenancebacklogat approximately$11billion.–GradeC- 1 StatisticsprovidedbyASCE
AnOverviewofOurCurrentAging InfrastructurebyCategory » Schools1: AlmosthalfofAmerica’spublicschoolswerebuiltto educatethebabyboomers– agenerationthatis nowretiringfromthe workforce.Publicschoolenrollmentisprojectedto graduallyincrease through2019,yetstateandlocalschoolconstructionfunding continuesto decline.Nationalspendingonschoolconstructionhas diminishedtoapproximately$10billionin2012,abouthalfthelevel spentpriorto therecession,whiletheconditionofschoolfacilities continuesto bea significantconcernforcommunities.Expertsnow estimatetheinvestmentneededtomodernizeandmaintainour nation’sschoolfacilitiesis atleast$270billionormore.– GradeD 1 StatisticsprovidedbyASCE
AnOverviewofOurCurrentAging InfrastructurebyCategory » Energy1: Americareliesonanagingelectricalgridandpipeline distributionsystems,someofwhichoriginatedinthe1880s. Investmentinpowertransmissionhasincreasedsince2005,but ongoingpermittingissues,weatherevents,andlimitedmaintenance havecontributedto anincreasingnumberoffailuresandpower interruptions.Whiledemandfor electricityhasremainedlevel,the availabilityofenergyin theform ofelectricity,naturalgas,andoilwill becomeagreaterchallengeafter2020asthepopulationincreases. Althoughabout17,000milesofadditionalhigh-voltagetransmission linesandsignificantoilandgaspipelinesare plannedoverthenext fiveyears,permittingandsittingissuesthreatentheircompletion.– GradeD 1 StatisticsprovidedbyASCE
AnOverviewofOurCurrentAging InfrastructurebyCategory » In summary,theoverallgradeis D+withanestimatedcostto improve/costto cureof$3.6trillion!1 1 StatisticsprovidedbyASCE
How Do WeEvaluateOurState’sInfrastructure? Capacity–Evaluatetheinfrastructure’scapacitytomeetcurrentand futuredemands. Condition–Evaluatetheinfrastructure’sexistingor nearfuture physicalcondition. Funding – Evaluatethecurrentleveloffunding(fromalllevelsof government)fortheinfrastructurecategoryandcompareitto the estimatedfundingneed. FutureNeed–Evaluatethecostto improvetheinfrastructureand determineiffuturefundingprospectswillbeableto meettheneed.
How Do WeEvaluateOurState’sInfrastructure? Operation andMaintenance–Evaluatetheowners’abilityto operateandmaintainthe infrastructureproperlyanddeterminethattheinfrastructureisin compliancewith governmentregulations. PublicSafety–Evaluatetowhatextentthepublic’ssafetyisjeopardizedbythe conditionofthe infrastructureandwhattheconsequencesoffailuremaybe. Resilience–Evaluatetheinfrastructuresystem’scapabilitytopreventorprotectagainstsignificantmulti-hazardthreatsandincidentsandtheability toexpeditiouslyrecoverandreconstitutecriticalserviceswithminimumdamageto publicsafetyandhealth,the economy,andnationalsecurity. Innovation–Evaluatetheimplementationandstrategicuseofinnovative techniquesanddeliverymethods.
WhatShouldWeDo Next? » Encouragetheuseofassetmanagementprogramsinaneffortto maintainaninventoryofallyourcapitalandinfrastructureassets » Establisha rehabilitationandrepairfundingprogram » Developemergencyactionplansforeveryhighhazardinfrastructure category » Requireinsurancewhereappropriate » Ensurethatoperationandmaintenanceplanscoverallaspectsof complexinfrastructureassetclassifications » Maketherepairofstructurallydeficientbridgesa“top priority” » Increaseannualinvestmentlevelsforbridgerepair,reconstructionand renovation
WhatShouldWeDo Next? » Prioritizecapitalprojects » Streamlinetheprojectapprovalanddeliveryprocess » Adoptnewtechnologies » Developperformancebasedinvestmentstrategies » IncreaseinvestmentfromtheprivatesectorviaPublicPrivate Partnerships(P-3’s)
Let’sDiscussPublicPrivatePartnerships(P-3’s) » WhatAreP-3’s? › Theytypicallydeliver publicservicesthroughagreementsbetweengovernment agenciesand private firms.ThePublicPartnertypicallyownsthe assets, usually througha longtermgroundlease.Thebusinessfinancesand buildsfacilitiesas well asoperatesthepartnerships.P-3’spurpose isnottooutsource, orprivatize government,rather collaborativelyworkwiththegovernment toperform operationsmoreefficientlyand effectively.
Let’sDiscussPublicPrivatePartnerships(P-3’s) » WhyShould a State orLocalGovernmentAdopttheP-3Concept? › P-3’senablestateand local governmentstoimplement“key”projectsthatthey would otherwise postpone orignore duetobudgetconstraintsorotherpriorities. Manygovernmental entitieshaveexpanded theP-3conceptbeyondthetypical “infrastructure”assetcategorytoinvolvealltypesofpublicfacilitiesfrom transportation,towaterwater/wastewateroperations,tohospitals,libraries, schoolsandcorrectionalfacilities. ByenteringintoP-3relationshipsand collaboratingwiththeprivatesector on design,financialrequirements, constructionandmaintenanceforlarge and longtermprojects, thereturnon investment orproceedscanbeutilizedforother“key” projects.
Let’sDiscussPublicPrivatePartnerships(P-3’s) » ThreePrimary ComponentsforSuccessfulP-3’s • Legal: Definethelongtermworkingrelationship betweentheprivatecompany an thegovernmentalentityastheP-3relationshipcanscana periodof30, 40, 50 or99yearterms.This componentshouldhave thefollowing goalsofboth parties,in termsofriskmitigation: • Protectthepublic’sbest interest • EstablishthelegalframeworkofaP-3 • Establishthebusinesstermsandconditionsincollaborationwiththe parties’legal counsel • Establishthestatutesastowhattheowner canandcannot do • Establishafoundationforboththegovernment andtheprivatesectorto succeed
Let’sDiscussPublicPrivatePartnerships(P-3’s) • » ThreePrimary ComponentsforSuccessfulP-3’s(cont.) • Financial: Therearethreemajor steps. • Determinethevalue ofthe assetstobeincludedin thetransaction • Determinehowtheprojectwill be paidforandidentifythefinancial contribution onbothsidesofthetransaction • DeterminethattheP-3model optimizesthevaluetothegovernment and its citizens
Let’sDiscussPublicPrivatePartnerships(P-3’s) » ThreePrimary ComponentsforSuccessfulP-3’s(cont.) • Technical: Establishingtheresponsibilitiesofthecontractor,addressingall aspectsofdesign,environment,construction, operationsandmaintenance,such as • Estimatingcosts • Coordinatingandmanaging budgets • DevelopcriteriatomonitortheP-3(s)
Let’sDiscussPublicPrivatePartnerships(P-3’s) » To date,approximately34statesandkeyfederalgovernmentagencies haveadoptednewP-3 legislation » TheP-3 conceptenablesstateagenciestoengagebusinessinthe planning,financing,buildingandoperatingpublicprojects,fromroads andrail toschoolsandotherinfrastructures.
ContactInformation KevinJ. McHugh| ManagingDirector Valuation& FinancialRisk Management kevin.mchugh@ncacf.com646.227.4701 direct 646.227.4634 fax 90 ParkAve.,10thFloor|NewYork,NY10016