Download
1 / 9
90 likes | 180 Views
Triangle of Painful Choices. National Institute for Health Care Management April 2, 2013. http://nihcm.org/administrator/components/com_civicrm/civicrm/extern/url.php?u=11529&qid=591362. Achieving longer-term fiscal solvency requires hard decisions on revenue and spending.

E N D
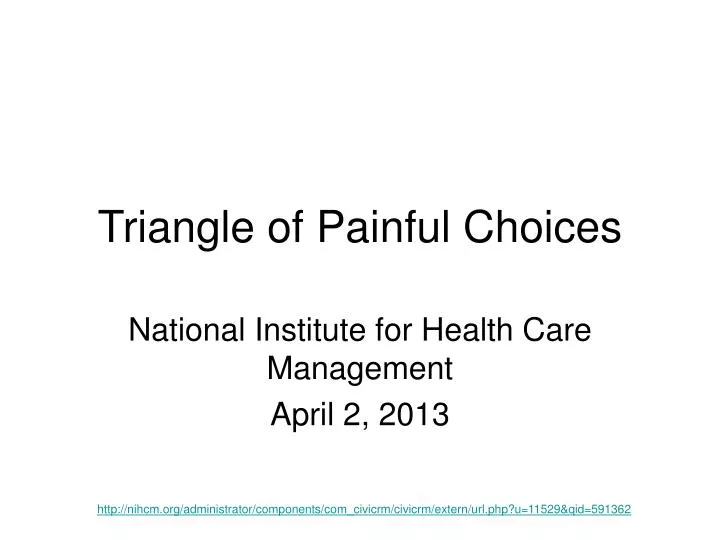
Triangle of Painful Choices National Institute for Health Care Management April 2, 2013 http://nihcm.org/administrator/components/com_civicrm/civicrm/extern/url.php?u=11529&qid=591362
Achieving longer-term fiscal solvency requires hard decisions on revenue and spending.
Triangle of Painful Choices • The magnitude of the changes necessary to balance the budget is illustrated in an Altarum model known as the Triangle of Painful Choices. • The model sets the goal of balancing the budget by 2035 and assumes that spending on Social Security and interest remain fixed at the 2012 levels as a percentage of GDP. (Of course, with an aging population and interest rates at historic lows, these assumptions may be optimistic.)
TPC-2 • In this model, if we can hold health spending growth to the same pace as potential GDP and if tax revenue amounts to 19 percent of GDP, then we can balance the budget only if our spending on defense and all other non-health activities is 6 percent of GDP (point A). This is roughly half the 2012 spending level. • Higher tax revenues would support correspondingly higher spending for defense and other non-health activities (points B and C, for example)—as long as health spending grows at the same rate as the PGDP. However, our more likely choice set lies to the right of the ABC line, with more rapid growth in health spending requiring even deeper spending cuts or higher taxes.