Download
1 / 40
400 likes | 514 Views
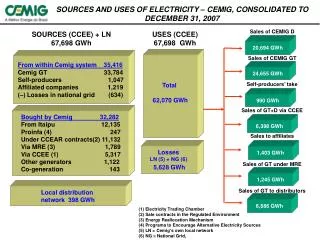
Consolidated Results as of December 31, 2011. Meeting on April 26, 2012. Solid operating performance Business activity solid resulting from industrial strategy and commercial growth Operating margin impacted by changes in the PCB markets and exogenous and/or non-recurring expenses

E N D
Consolidated Results as of December 31, 2011 Meeting on April 26, 2012
Solid operating performance Business activity solid resulting from industrial strategy and commercial growth Operating margin impacted by changes in the PCB markets and exogenous and/or non-recurring expenses High net income from consolidated companies Financial profile confirmed Substantial cash flow linked to level of operating margins Investment up markedly: growth in new businesses Financial debt maintained at a corporate level Proposed dividend Revenue up +5.5% COI at 13.5% of revenue ICC at 10.4% of revenue Cash flow at 20.5% of revenue Capex at11.8% of revenue Net debt at 1.96x EBITDA €1.30 per share unchanged 2011 highlights 2
Vision and strategy • Financial situation bolstered • New financing totaling €188.3m • Stable financial ratios and financial situation with low debt • Maturity of debt extended to 6 years • Commercial dynamics and increasing market share • Historic recovery and treatment businesses: solid positioning on regulated markets • New businesses: development in sorting, energy production (waste recovery, etc.) • Outsourcing markets: strategy focused on increasing share of public service delegation markets and comprehensive offers 3
Consolidated results and financial situation as of December 31, 2010 4
Operating margins reflecting changes in the business mix and affected by non-recurring and/or exogenous items (*) restated for changes in the accounting presentation on renewal expenses of disposed assets and site rehabilitation 5
Strong activity in 2011: revenue up +5.5% • NHW: recurring markets and commercial momentum • Commercial successes: contribution of new public service delegations (Sénerval, Oléron, etc.) • Good performance of recovery and rehabilitation businesses (La Gabarre) • IFRIC 12 revenue: concession investments for €1.3m +5.5% in €m 424.2 402.1 +14.3% +1.0% • HW: solid activity excluding PCB • Solidity of treatment and recovery activity (incineration, platforms, regeneration, etc.) • Marked drop in PCB markets: -29.4% to €26.4m (vs. €37.4m in 2010) Excluding PCB, the division was up +6.0% as of 12/31 Consolidated revenue 6
Reminder: change in accounting presentation IFRS consolidated data COI neutral Impact on 2010 EBITDA: EUR +2.3m • Renewal expenses for disposed assets EUR +1.7m • Other expenses (rehabilitation, etc.): EUR +0.6m 7
Impact of exogenous items on the operating margin IFRS consolidated data • France (97% of EBITDA): • EBITDA maintained at high level integrating: • Changes in business mix (including PCB): EUR -4.3m • Exogenous and/or non-recurring factors: EUR -€4.5m International Improvement of operating contribution linked to strong business in Europe 8
Changes in EBITDA hit by PCB markets and by exogenous and/or non-recurring factors Organic growth Business mix 103.7 Exogenous and/or non-recurring factors (4.3) +2.5 (2.5) 97.4 (1.6) Energy (0.4) Maintenance excl. new public service delegations Other o/w PCB: (3.1) o/w turbine S3: (0.8) EBITDA 2011 EBITDA 2010 as of 12/31 Consolidated data in €m 9
Change in current operating income IFRS consolidated data 66.9 Changes in COI Non-recurring factors (6.3) • Change in operating income • Non-renewal of expenses linked to IFRS, as revised: EUR -4.9m in 2010 • Expenses related to financial stakes: EUR -0.9m 57.4 D EBITDA (1.8) 1.4 (2.8) Provisions for litigation Sénerval public service delegation (full year) Rehabilitation provision COI 2011 COI 2010 10
Increase in net income: ICC at 10.4% of revenue Consolidated data in €m (under IFRS) • Positive financial income posting a €1.4m improvement • Drop in average net debt and cost of debt improved to 3.59% (vs. 4.07% in 2010): EUR +1.6m • Nominal corporate tax of 30.8% vs. 31.5% in 2010 • Part of interest on convertible bonds not taxed • Disposal bonus not taxed, recognized in H1 2011 11
Net income at 3.7% of revenue Consolidated data in €m (under IFRS) Increase in the Hime book loss: €(28.4)m vs. €(19.2)m 12
Solid management of maintenance investmentIncrease in capex Booked capex €m i.e. 11.8% of revenue 50.2 Sorting, recoveries, platforms … 33.9 20.7 Total as of December 31, 2011: €50.2m o/w landfill cells: €8.9m Net capex paid: €50.1m (vs. €27.0m in 2010) 13
Change in operating cash flow, reflecting the increase in capex Consolidated data in €m (under IFRS) Change in EBITDA + Public service delegation + rehabilitation expenses Optimization of current assets • Change in corporate tax paid: • Advanced payment discrepancies from previous years totaling €(9.8)m 14
Growth paid in cashDeleveraging Consolidated data in €m D WCR Tax Cash flow 11.3 Net CAPEX payments (23.6) o/w financial: €0.3m (50.5) 86.8 net of new borrowings contracted over the year for €21.3m Dividends D loans (11.1) 42.8 (31.7) 24.0 Cash 12/31/10 Cash 12/31/11 15
Margins maintained at a corporate level Consolidated data in €m Ratios calculated using the banking agreement method Covenants: Gearing < 1.1 Leverage < 3 16
Structure of Group debt • Reminder: previous credit agreement • €162.5m in senior debt has a maturity of 4/12/2012 • New financing: • Amount: €183.3m • Target: refinancing of the residual senior debt • New banking contract: €163.3m • Maturity: 5 years (April 2017) amortised by 5% tranche every 6 months starting in 2013 • Lead arrangers: Crédit Agricole Group and Société Générale Group • Bonds: €25.0m • Redeemed in one lump sum at maturity • Maturity 2019 • Total Group debt after refinancing • Financial fees estimated at €11m in 2012, i.e. net cost of debt of 4.95% including hedging costs (vs. 3.59% in 2011) • Hedging rates: 85% • Maturity: 6 years • Covenants unchanged: • Gearing: 1.1x shareholders' equity • Leverage: 3x EBITDA 17
Change in consolidated shareholders’ equity Consolidated data in €m ICC Dividends (11.1) 400.1 (1.6) 44.0 (28.4) Miscellaneous (o/w fair value of assets and hedges) Share of Hime's net income 368.8 (16.0) (0.3) 355.4 Share of fair value of Hime hedges Other Shareholders’ equity (Group share) as of 12/31/10 Shareholders' equity (Group share) as of 12/31/2011 before Hime share Shareholders’ equity (Group share) as of 12/31/2011 18
Hime - SaurConsolidated results and financial situation as of December 31, 2011 19
Revenue +5.7% (+3.1% at constant scope) HIME in €m +5.7% 1,646.5 1,557.0 +5.1% Good performance of secondary raw materials +5.9% • France: +5.9% to €1,176.7m (+2.4% at constant scope, i.e. a scope effect of €40.5m) • Solidity of Water and Decontamination markets (+4.3%) • Contribution from Stéreau down (-16.5%) International: +4.9% to €128.0m • Good level of activity in Spain • Rate hikes in Poland • Contribution of new contracts in the Middle East as of 12/31 Consolidated revenue (at current scope) 20
Resilient operating margins HIME • Stability of EBITDA: EUR -0.5m • Water: weather effects (EUR -7.0m) partially offset by improved contribution of international business and operating performance gains (EUR +3.1m) • Environmental services: increase in secondary raw materials was hampered by increasing cost of energy IFRS consolidated data • Changes in COI: EUR -0.5m • 2010: impact of the revised corporate tax base for €15.3m • Increase in allocations to amortization: EUR -6.5 million • International provisions • Increase in other operating expenses: EUR -4.1 million 21
Change in EBITDA: contribution by Division HIME Environmental services 187.0 186.6 Water (3.5) +3.1 Secondary raw materials: EUR +1.0m Improvement in the management of contracts: EUR +5.4m Energy: EUR -3.3m Weather effects: EUR -7.0m Growth of activities and productivity gains offset the impact of commercial effects EBITDA 2011 EBITDA 2010 as of 12/31 Consolidated data in €m 22
Slight drop in financial income HIME Consolidated data in €m (under IFRS) Increase in net cost of debt (exc. convertibles): 5.32% vs 5.16% in 2010 o/w change in commitments for UK pensions: EUR -2.4m Interest expenses: EUR +2.5m Non-renewal of accretion expense recognized in 2010: €3.4m 23
Breakdown of TaxDeterioration of Net Income HIME Consolidated data in €m (under IFRS) 2010: activation of tax losses on Guestagua (Spain) o/w impact of the finance law on the limitation of tax losses: €15m 24
Investments up sharply: +40.6% HIME Booked gross capex €m 107.7 76.6 Productivity investments Spain (acquisition of "canones"): €21.2m External growth: €15.7m as of 12/31 25
Contraction in operating flows Stability of WCR: 2010: positive temporary effects of disbursements for paid leave (EUR +33m) and LME law (€33m) HIME Consolidated data in €m (under IFRS) Financing: credit line drawn (€30m) 26
Increase in net debtSlight deterioration of financial ratios HIME €m x EBITDA Consolidated data in €m Net financial debt (excluding convertibles): €1,659.6m vs. €1,553.9m at end-2010 Leverage calculated using the loan agreement method 27
High added value business lines on regulated markets Growth markets with barriers to entry Hierarchy of principles (2008 UE Directive ) High value added businesses 1 Outsourcing Eco-services Prevention Equipment rehabilitation Solvent regeneration Re-utilization Products Recovery 2 Chemical purification Fine Sorting Material recovery Raw Materials 3 Power generation (biogaz, methanization) SRF production Cogeneration Energy recovery Energy 4 Health Depollution Dehydratation Thermal treatments Storage Treatments Safe seclusion 5 Environment 29
Change in business mix: PCB impact, improving performance of sorting/recovery businesses and contractual business NHW storage HW storage HW incineration Other HW treatment NHW incineration Energy recovery Recovery of materials Sorting/processing HW and NHW Comprehensive services Decontamination Eco-services 2010 revenue: €402.1m 55% Revenue 2005 : € 338m 26% Waste treatment Recovery 28% 52% 2011 revenue: €424.2m 30
Change in business mix: impact of PCB changes and growth of the HW division Change €m -17.7% -4.1% -36.6% -51.4% Comparative changes in HW revenue by quarter Changes in PCB revenue by quarter 31
Resilience of marketsSolidity of client bases Breakdown of revenue by client base and by division Breakdown of revenue by sector of activity as of December 31, 2011 Non-hazardous waste 36% Hazardous waste 64% as of December 31, 2011 32
Pursuing the growth strategy:Alcea, another public service delegation contract won • "La Prairie de Mauves", waste treatment and energy recovery centre in Nantes Métropole • Waste treatment capacity: 135Kt • 3 business lines: • Transfer • Sorting: Tri'sac process • Energy recovery • Heat sold to the collective heating network (15,000 households) • Employees: 45 jobs maintained within a dedicated company, Alcéa Alcea(AlceaSetosa) 33
Alcea: main financial data • A 12-year industrial project for improving technical and environmental performances • Extension of the optical sorting system at the separation facility enabling selective collection materials to be integrated • Improvement in sorting performance: modernization of metal and non-metal extraction; maximizing recovery of secondary raw materials • Reinforcing energy efficiency: optimizing electricity production throughout the year • A contract totaling around €144m (excluding IFRIC 12) over 12 years • Effective date: October 12, 2012 • Contribution to full-year consolidated revenue: around €12m/year (excluding IFRIC 12 revenue) • IFRIC 12 investments: €12m between 2013 (€7m) and 2014 (€5m) 34
Lescar facility (Pau): strengthened presence in the southwest • Séché to operate the UIOM (household waste incinerator) • Previous situation: • BéarnEnvironnement, delegation contract holder • Novergie, sub-contractor operating the UIOM • 12/5/11: BéarnEnvironnement, a subsidiary of Séché, takes over the operation of the plant • Improving the UIOM • Additional facilities: • Businesses: thermal treatment of household waste and DASRI; composting platform for green waste; platform for maturing slag • Revenue of €8m forecast for 2012 (vs. €4m in 2011) • Environmental aspect: ISO 50001 certification procedure launched 35
Q1 Activity Outlook for 2012 36
Business activity as of March 31, 2012: revenue up +2.6% +2.6% • NHW: solidity of recovery and treatment markets • Good performance of incineration and eco-services • IFRIC 12 revenue: concession investments for €1.9m in €m 105.3 102.6 +8.6% -0.8% • HW: solid activity excluding PCB • Continuation of falling growth in PCB markets: -40.7% to €4.3m (vs. €7.3m in Q1 2010) Excluding PCB, the division was up 4.3% • Solidity of treatment and recovery activity (incineration, platforms, etc.) • International: -0.9% to €5.8m (vs. €5.7m) penalized by Latin America (PCB) as of 3/31 Consolidated revenue 37
Hime: Q1 activityRevenue up +4,2% (+2,6% at constant perimeter) HIME In €m +4.2 % 401.5 385,3 Bad weather conditions +0.5 % +5.2 % • France : +3.1% at € 282,4m (+0.8% at constant perimeter, i.e. perimeter effect of € 6.2m) • Solid Water and Sanitation markets (+3.1% at constant perimeter) • Lower contribution of Stéreau (-11.3%) International : +24.4% à € 37.5m • New contracts in Middle East As of 03/31 Consolidated revenue (at current perimeter) 38
Outlook for 2012 Uncertain macro-economic environment Resiliency of markets HW division: Solidity of treatment and recovery markets Continuation of falling growth in PCB markets NHW division: Recurring utilities markets Growth of recovery activities Commercial growth on opportunity-laden markets Continuing growth in trends observed at the start of the year Operating margins impacted by the unfavorable change in PCB activities: COI could reach approximately 12% of revenue in 2012 (excluding IFRIC 12 revenue), which would represent a low point compared with future years 39
Séché Environnement chose Electrogeloz, a printing press certified by Imprim-Vert®, and printed this document on Cyclus Office, 100% recycled paper. Q&AManuel Andersenm.andersen@groupe-seche.comwww.groupe-seche.com