Download
1 / 33
330 likes | 465 Views
QG Analysis: Low-Level Systems. Will these Surface Lows Intensify or Weaken? Where will they Move?. QG Analysis. QG Theory Basic Idea Approximations and Validity QG Equations / Reference QG Analysis Basic Idea Estimating Vertical Motion QG Omega Equation: Basic Form

E N D
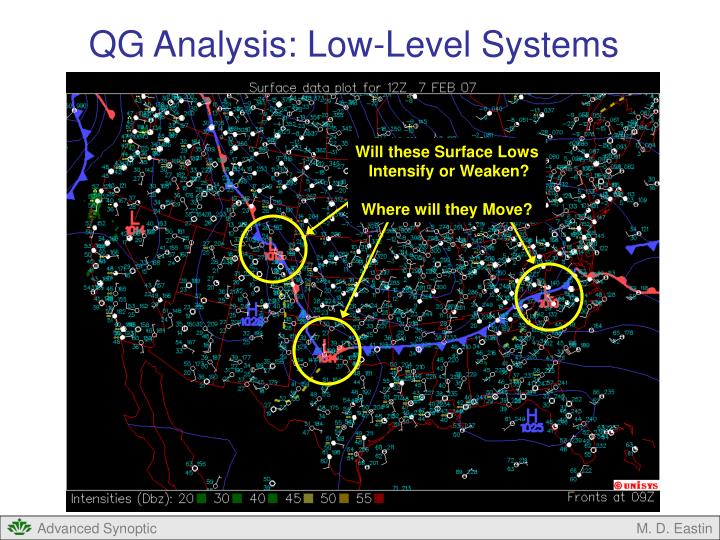
QG Analysis: Low-Level Systems Will these Surface Lows Intensify or Weaken? Where will they Move? M. D. Eastin
QG Analysis • QG Theory • Basic Idea • Approximations and Validity • QG Equations / Reference • QG Analysis • Basic Idea • Estimating Vertical Motion • QG Omega Equation: Basic Form • QG Omega Equation: Relation to Jet Streaks • QG Omega Equation: Q-vector Form • Estimating System Evolution • QG Height Tendency Equation • Diabatic and Orographic Processes • Evolution of Low-level Systems • Evolution of Upper-level Systems M. D. Eastin
QG Analysis: Low-Level Systems • Goal: We want to use QG analysis to diagnose and “predict” the formation, • evolution, and motion of low-level (or surface) cyclones and anticyclones • Which QG Equation? • We cannot apply the QG height-tendency equation • Lower boundary condition assumes no height tendency at the surface • Contrary to what we are trying to infer… • We can use the QG omega equation • Evaluate above the surface • Then we can use QG theory to infer low-level (or surface) pressure changes Vertical Motion Differential Vorticity Advection Thermal Advection + Diabatic Forcing + Topographic Forcing M. D. Eastin
QG Analysis: Low-Level Systems • Local application of the QG Theory at the Surface: • If rising motion (ω < 0) is present above the surface (where ω = 0), then we know: • Recall: • We can then infer from the QG vorticity equation that: • Recall: • Using the relationship between vorticity tendency and height tendency we thus know: • Recall: and • Finally, using the height / pressure tendency relationship via hydrostatic balance: • Since: via • Therefore: Rising motions aloft → Surface pressure decreases • Sinking motions aloft → Surface pressure increases QG continuity equation Equivalent to low-level convergence M. D. Eastin
Combined Effects of Forcing • Evaluate Total Forcing: • You must consider the combined effects from each forcing type in order to infer the • expected totalvertical motionand surface pressure change • Sometimes one forcing will “precondition” the atmosphere for another forcing • and the combination will enhance low-level (or surface) cyclogenesis • Other times, forcing types will oppose each other, inhibiting (or limiting) any • low-level (or surface) cyclogenesis • Note: Nature continuously provides us with a wide spectrum of favorable and unfavorable • combinations…see the case study and your homework Vertical Motion Differential Vorticity Advection Thermal Advection + Diabatic Forcing + Topographic Forcing M. D. Eastin
Favorable Combinations of Forcing Vorticity Advection with Temperature Advection: Scenario: A region of increasing PVA with height (located downstream from a trough) is collocated with a region of strong warm air advection PVA Upper Levels Vort Max WAA Lower Levels M. D. Eastin
Favorable Combinations of Forcing Temperature Advection with Diabatic Heating: Scenario: A region of strong warm advection collocated with deep convection Commonly observed near warm fronts and in the warm sector WAA M. D. Eastin
Favorable Combinations of Forcing Vorticity Advection with Temperature Advection and Diabatic Heating: Scenario: A region of increasing PVA with height (located downstream from a trough) is collocated with a region of warm air advection and deep convection PVA Upper Levels Vort Max Lower Levels WAA M. D. Eastin
Favorable Combinations of Forcing Vorticity Advection with Downslope Motions: Scenario: A region of increasing PVA with height (located downstream from a trough) is located over the leeside of a mountain range PVA Upper Levels Vort Max Downslope Motions Lower Levels M. D. Eastin
Unfavorable Combinations of Forcing Vorticity Advection with Temperature Advection: Scenario: A region of increasing PVA with height (located downstream from a trough) is collocated with a region of strong cold air advection PVA Upper Levels Vort Max Lower Levels CAA M. D. Eastin
Unfavorable Combinations of Forcing Vorticity Advection with Downslope Motions: Scenario: A region of increasing NVA with height (located upstream from a trough) is located over the leeside of a mountain range Upper Levels NVA Vort Max Downslope Motions Lower Levels M. D. Eastin
Example Case: Formation / Evolution Will these Surface Lows Intensify or Weaken? M. D. Eastin
Example Case: Formation / Evolution Differential Vorticity Advection: L L L M. D. Eastin
Example Case: Formation / Evolution Differential Vorticity Advection: L L NVA Assume NO vorticity advection below Sinking Motion Surface Pressure Increases L PVA Assume NO vorticity advection below Rising Motion Surface Pressure Decreases M. D. Eastin
Example Case: Formation / Evolution Thermal Advection: L L L M. D. Eastin
Example Case: Formation / Evolution Thermal Advection: L L WAA Rising Motion Surface Pressure Decreases L CAA Sinking Motion Surface Pressure Increases M. D. Eastin
Example Case: Formation / Evolution Diabatic Forcing: L L L M. D. Eastin
Example Case: Formation / Evolution Diabatic Forcing: Note: Time is 12Z or 5:00-7:00 am (before or at sunrise) Note the snow and cloud cover Diabatic Cooling Sinking Motion Surface Pressure Increases L L Note the clear skies Diabatic Heating Rising Motion Surface Pressure Decreases L M. D. Eastin
Example Case: Formation / Evolution Topographic Forcing: Note direction of surface winds from the previous slide L L L M. D. Eastin
Example Case: Formation / Evolution Topographic Forcing: Note direction of surface winds from the two slides ago Downslope Flow Rising Motion Surface Pressure Decreases L L L M. D. Eastin
Example Case: Formation / Evolution Moderate NVA D Weak CAA D Diabatic Cooling D Downslope Flow U ----------------------------------------------------------- Net Pressure Rise D/R ----------------------------------------------------------- 15Z: Pressure rose 2 mb Weak PVA U Moderate CAA D Diabatic Heating U Downslope Flow U ----------------------------------------------------------- Net Pressure Fall U/F ------------------------------------------------------------ 15Z: Pressure fell 1 mb Moderate NVA D Weak WAA U Diabatic Cooling D Downslope Flow U ----------------------------------------------------------- Net Pressure Rise D/R ----------------------------------------------------------- 15Z: Pressure rose 3 mb M. D. Eastin
QG Analysis: Low-level System Motion Will this Surface Low Move? M. D. Eastin
QG Analysis: Low-level System Motion • Goal: Use QG theory to diagnose the motion of low-level (or surface) systems • Application of QG Theory: • Surface cyclones always move away from regions with pressure increases toward regions with pressure decreases • In essence, surface cyclones “move down the pressure change gradient” • CycloneRegions of sinking motion → Regions or rising motion • Motion Regions of NVA aloft → Regions of PVA aloft • (From → To) Regions of CAA → Regions of WAA • Regions of diabatic cooling → Regions of diabatic heating • Regions of upslope flow → Regions of downslope flow • AnticycloneRegions of rising motion → Regions of sinking motion • Motion Regions of PVA aloft → Regions of NVA aloft • (From → To) Regions of WAA → Regions of CAA • Regions of diabatic heating → Regions of diabatic cooling • Regions of downslope flow → Regions of upslope flow M. D. Eastin
QG Analysis: Low-level System Motion • Influence of Topography: • Consider a cyclone (low pressure system) east of a mountain range: • Motion will be to the south • along the range • Consider an anticyclone east of a mountain range • Motion will be to the south • along the range Upslope Flow → Pressure Increase L Downslope Flow → Pressure Decrease Downslope Flow → Pressure Decrease H Upslope Flow → Pressure Increase M. D. Eastin
QG Analysis: Low-level System Motion • Influence of Topography and Temperature Advection: • Consider a low pressure system initiallyjust east of a mountain range: • Motion will be • to the southeast • Consider the low at a later time southeast of the mountain range • Motion will now be to • the east-southeast • As the low moves further away from the mountain range, it begins to feel less topographic effects and more temperature advection effects → acquires a more northeastward motion Upslope Flow → Pressure Increase T-2ΔT L WAA → Pressure Decrease T-ΔT T Downslope Flow → Pressure Decrease Weaker Upslope Flow → Pressure Increase T-2ΔT T-ΔT WAA → Pressure Decrease T L Weaker Downslope Flow → Pressure Decrease M. D. Eastin
Example Case: Motion Where will this Surface Low Move? M. D. Eastin
Example Case: Motion Differential Vorticity Advection: L Maximum PVA Assume NO vorticity advection below Expect motion toward the south M. D. Eastin
Example Case: Motion Thermal Advection: L Maximum WAA Expect motion toward the southeast M. D. Eastin
Example Case: Motion Diabatic Heating: L Maximum Heating Expect motion toward the northwest M. D. Eastin
Example Case: Motion Flow over Orography: L Maximum Downslope Flow Expect motion toward the southwest M. D. Eastin
Example Case: Motion Motion Summary Initial Location Heating L L Downslope WAA PVA Expected Motion Later Location M. D. Eastin
QG Analysis: Low-level Systems • Application Tips: Evolution and Motion • ALL relevant forcing terms should be analyzed in each situation!!! • Differential vorticity advection and thermal advection are the dominant terms • in the majority of situations → weight these terms more • Diabatic forcing can be important for system evolution when deep convection • or dry/clear air are present. • Diabatic forcing can be important for system motion when the forcing • is asymmetric about the system center • Topographic forcing is only relevant near large mountain ranges or rapid • elevation changes over a short horizontal distance M. D. Eastin
References Bluestein, H. B, 1993: Synoptic-Dynamic Meteorology in Midlatitudes. Volume I: Principles of Kinematics and Dynamics. Oxford University Press, New York, 431 pp. Bluestein, H. B, 1993: Synoptic-Dynamic Meteorology in Midlatitudes. Volume II: Observations and Theory of Weather Systems. Oxford University Press, New York, 594 pp. Charney, J. G., B. Gilchrist, and F. G. Shuman, 1956: The prediction of general quasi-geostrophic motions. J. Meteor., 13, 489-499. Durran, D. R., and L. W. Snellman, 1987: The diagnosis of synoptic-scale vertical motionin an operational environment. Weather and Forecasting, 2, 17-31. Hoskins, B. J., I. Draghici, and H. C. Davis, 1978: A new look at the ω–equation. Quart. J. Roy. Meteor. Soc., 104, 31-38. Hoskins, B. J., and M. A. Pedder, 1980: The diagnosis of middle latitude synoptic development. Quart. J. Roy. Meteor. Soc., 104, 31-38. Lackmann, G., 2011: Mid-latitude Synoptic Meteorology – Dynamics, Analysis and Forecasting, AMS, 343 pp. Trenberth, K. E., 1978: On the interpretation of the diagnostic quasi-geostrophic omega equation. Mon. Wea. Rev., 106, 131-137. M. D. Eastin