Download
1 / 24
240 likes | 381 Views
Analysis of Financial Statements. Ing. Zuzana Čierna, PhD. Department of Finance SPU – FEM, Nitra. Introduction.

E N D
Analysis of Financial Statements Ing. Zuzana Čierna, PhD. Department of Finance SPU – FEM, Nitra
Introduction A wide range of valuable financial information is available on the Internet. With just a couple of clicks, an investor can easily find the key financial statements for most publicly traded companies.
Financial statement analysisinvolves comparing the firm‘s performance with that of other firms in the same industry and evaluating trends in the firm‘s financial position over time. • Financial managers evaluate a firm‘s current financial position. • Results of FAhelp management identify deficiencies and than take action to improve performance.
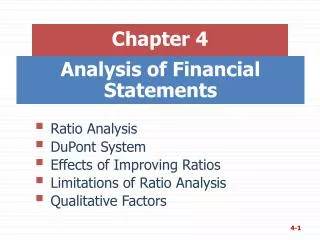
Ratio analysis • Liquidity ratios • Asset management ratios • Debt management ratios • Profitability ratios
If a firm has too many assets, its cost of capital will be too high, hence its profits will be depressed. On the other hand, if assets are too low, profitable sales will be lost.
Days sales outstanding (DSO), also called the “average collection period” Note that in this calculation we used a 365-day year. Other analysts use a 360-day year for this calculation.
Fixed Assets Turnover Ratio The ratio of sales to net fixedassets. The fixed assets turnover ratio measures how effectively the firm uses itsplant and equipment.
Debt Ratio measures the percentage of funds provided by creditors. • There are a variety of factors that determine a company’s optimal debt ratio. • Creditors may be reluctant to lend the firm moremoney, and management would probably be subjecting the firm to the risk ofbankruptcy if it sought to increase the debt ratio any further by borrowing additionalfunds.
Stockholders invest to get a return on their money, and this ratio tells how wellthey are doing in an accounting sense.
Ratio analysis involves comparisons — a company’s ratios are comparedwith those of other firms in the same industry, that is, to industry averagefigures. Ratio analysis is used by three main groups: (1) managers,whoemploy ratios to help analyze, control, and thus improve their firms’ operations; (2) credit analysts, including bank loan officers and bond rating analysts,who analyze ratios to help ascertain a company’s ability to pay its debts; and (3)stock analysts,who are interested in a company’s efficiency, risk, and growthprospects.
Exercise Selected items of financial statements:
Calculate the following...and interpret the results... • Current ratio • Quick ratio • Days sales outstanding (DSO) • Fixed assets turnover ratio • Debt ratio • Times-interest-earned (TIE) ratio • Return on total assets • Return on common equity