Download
1 / 13
130 likes | 225 Views
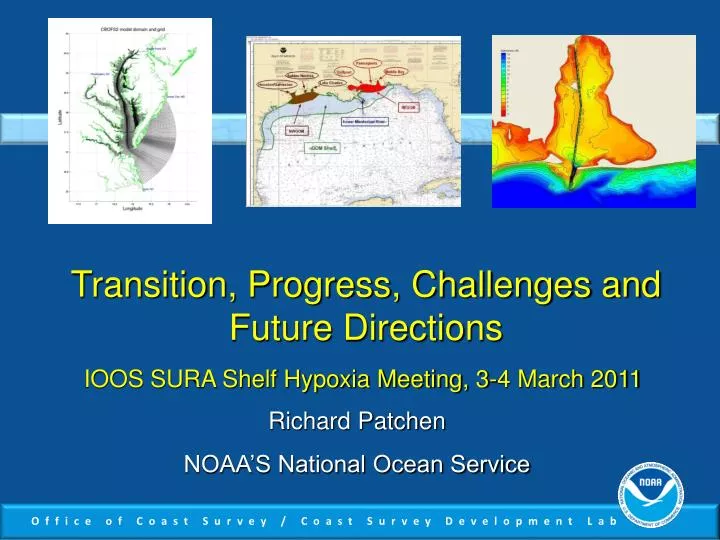
Transition, Progress, Challenges and Future Directions. IOOS SURA Shelf Hypoxia Meeting, 3-4 March 2011. Richard Patchen NOAA’S National Ocean Service. The Pathway from Research to Operations and Applications. IOOS SURA TESTBED. Evaluation and Testing, Development, Transition to Operations.

E N D
Transition, Progress, Challenges and Future Directions IOOS SURA Shelf Hypoxia Meeting, 3-4 March 2011 Richard Patchen NOAA’S National Ocean Service
The Pathway from Research to Operations and Applications IOOS SURA TESTBED Evaluation and Testing, Development, Transition to Operations Research and Development Value Added Product Development Operations Academia, IOOS Regional Associations, Research components of NOAA & other Fed Agencies NOS CSDL actively manage these interfaces, through community modeling partnerships Private Sector
CSDL Prototype Testbed: The Delaware Bay Model Evaluation Environment Bridgeton Maurice River Cape May Cape Henlopen Bathymetry Grids Metrics Model Hindcast COMMUNITY MODELS ROMS, POM, ADCIRC, FVCOM, ELCIRC, SELFE, .... Historical Data Environmental conditions Grids, Bathymetry, Environmental conditions
Chesapeake Bay Hypoxia Team Model Parameter Evaluation --- Model Metrics CBOFS2 - original synoptic hindcast run (06/01/2003 - 08/31/2005) As [1] but with river S = 0 As [1] but with river Q scaled with Wen Long's weights As [1] but with river S = 0 and river Q scaled with Wen Long's weights As [1] but with twice the number of vertical levels (same sigma formulation, Nz=40) As [1] but with a nearly uniform vertical grid with the same number of levels (Nz=20) As [1] but with ROMS 4th order Akima vertical T/S discretization & with vertical splines As [1] but with ROMS 4th order Akima vertical T/S discretization & without vertical splinesFor 1. – 6., we used spline vertical advection in the vertical for T/S advection with vertical splines.
Transition to a Regional Modeling Approach Individual Port Model Systems Regional Model Systems Modeling Issues Regional/Basin Model Nesting Data Assimilation Expanded Need for Comprehensive Data Sets Regional vs. Local Metrics IOOS SURA TESTBED
Coupling of Basin Model to Shelf/Estuary Model IOOS SURA Shelf Hypoxia Team Activities Investigate nesting algorithms/methodology, sensitivity and Robustness with Hetland’s MCH shelf model (ROMS) with Navy and NGOM NOS’s Northern Gulf Operational Forecast System (NGOFS) (FVCOM) with Navy and NGOM
SST Likelihood of Chrysaora Salinity Ecosystem Applications of Circulation Models Noxious biota - Sea nettle probabilities Harmful Algal Blooms – Red Tide West Florida Shelf Hazardous Materials Transport
3D Nested/Coupled ModelModel Results Initialization HAB patch 7-day Hindcast Need 3D velocities as 2D depth-averaged velocities miss near-shore upwelling behavior Observed Initial Patch Digitized Initial Patch Tracer patch method : Passive/Inert tracer evolution within ROMS Particle tracking method : CSDL’s Chesapeake Bay Oyster Larvae Tracker (CBOLT)
IOOS SURA Testbed Estuarine Hypoxia Team Strategy – begin with simplest WQ model and then build up to complex models • Model : examine hypoxia via DO using a 1-equation model with constant respiration (Malcolm Scully/ODU) • Model Set-up : embed DO model within NOAA/NOS Chesapeake Bay Operational Forecast System (CBOFS) DO in ROMS is a passive/inert tracer • Simulation : synoptic hindcast from June 01, 2003 - August 31, 2005 • ICs and BCs : DO saturation from T and S [Weiss (1970)]; no river DO sources • Computational Efficiency : 6-day sim./hour [MPI, IBM Power 6 cluster , 96 proc.] Const. resp. rate of 0.55 gO2/m3/day Fixed at saturation (surface also)
IOOS SURA Testbed Estuarine Hypoxia Team Preliminary Results DO ≤ 2 mg/L DO ≤ 1 mg/L DO ≤ 0.2 mg/L DO ≤ 2 mg/L at 1m above botm. • Total DO content (kg) diminishes during the summer months as expected • Hypoxic volumes show agreement with those derived from CBP observations* • Hypoxic zones present in deep, narrow channels during summer months *Courtesy of Malcolm Scully/ODU and Rebecca Murphy/JHU
IOOS SURA Testbed Estuarine Hypoxia Team NOS Work Plans Import ChesROMS biological module (based on Fennel’s) into CBOSF2 Compare DO predictions (and others if available) from various models (e.g. Scully’s 1-term, Fennel’s and ICM) Transition to operational ecological forecasting?
IOOS SURA Testbed Shelf Hypoxia Team NOS Work Plan Evaluate the embedded biological models in FVCOM Import Fennel’s model and its set-up for GOM into FVCOM Model comparisons of various biological configuration and ROMS vs FVCOM Transition to operational ecological forecasting?
Summary and Conclusions • The IOOS SURA Testbed supports previous/ongoing efforts to evaluate new modeling approaches and metrics. • The IOOS SURA Shelf Testbed is consistent with a transition from Port based Operational Forecast System to a Regional Approach by expanding effort of testing and validation of competing basin/shelf nesting approaches. • The IOOS SURA Testbed accelerated efforts to evaluate various approaches to address ecological issues, i.e., Hypoxia