Download
1 / 38
380 likes | 453 Views
IMPROVING LEARNING AND REDUCING COSTS The Case for Course Redesign. INCREASING ACCESS AND SUCCESS The Context. Barely 6 out of 10 degree-seeking freshmen graduate within 6 years Graduation rates are especially low for minority and low-income students

E N D
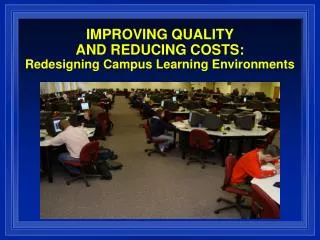
IMPROVING LEARNING AND REDUCING COSTSThe Case for Course Redesign
INCREASING ACCESS AND SUCCESSThe Context • Barely 6 out of 10 degree-seeking freshmen graduate within 6 years • Graduation rates are especially low for minority and low-income students • Many institutions lose 1 out of 4 students in the first year
INSTITUTIONAL RESPONSIBILITY FOR STUDENT SUCCESS • Learning communities • Student engagement (NSSE and CSSE) • First-year experience • Campus climate • Academic advising • Student support • Affective domain Emphasis on the “Extracurricular”
OUR FOCUS: LARGE-ENROLLMENT INTRODUCTORY COURSES • Successful course completion is critical for first-year students. • Typical drop-failure-withdrawal rates contribute heavily to overall institutional drop-out rates between the first and second year. • Research Us = 15% • Comprehensives = 22% to 45% • Community colleges = 40% to 50% or higher
Drop-Failure-Withdrawal RatesMathematics • Georgia State U 45% • Louisiana State U 36% • Rio CC 41% • U of Alabama 60% • U of Missouri-SL 50% • UNC-Greensboro 77% • UNC-Chapel Hill 19% • Wayne State U 61%
Drop-Failure-Withdrawal RatesOther Disciplines • Calhoun CC Statistics 35% • Chattanooga State Psychology 37% • Drexel U Computing 51% • IUPUI Sociology 39% • SW MN State U Biology 37% • Tallahassee CC English Comp 46% • U of Iowa Chemistry 25% • U of New Mexico Psychology 39% • U of S Maine Psychology 28% • UNC-Greensboro Statistics 70%
THAT’S THE GOOD NEWS! What do the grades represent? • Curving • Lack of consistency • Lack of coverage • Inflation • Lack of time on task = easier course Testing vs. Consistency
WHAT’S WRONG WITH THE LECTURE? • Treats all students as if they are the same • Ineffective in engaging students • Inadequate individual assistance • Poor attendance and success rates • Students fail to retain learning
WHAT’S WRONG WITH MULTIPLE SECTIONS? • In theory: greater interaction • In practice: large class size • In practice: dominated by the same presentation techniques • Lack of coordination • Inconsistent outcomes
PROGRAM IN COURSE REDESIGN Challenge colleges and universities to redesign their approaches to instruction using technology to achieve quality enhancements as well as cost savings. 50,000 students 30 projects
ASSUMPTIONS THAT GET IN THE WAY • Improving quality means increasing cost • Adding IT increases cost • Using IT may even threaten quality
TRADITIONAL INSTRUCTION Seminars Lectures
THE ONE PERCENT SOLUTION • Maricopa Community College District • 200,000 students • 2,000 course titles • 25 courses = 44% enrollment All CCs = 51% All four-year = 35%
Mathematics Iowa State University Northern Arizona University Rio Salado College Riverside CC University of Alabama University of Idaho Virginia Tech Statistics Carnegie Mellon University Ohio State University Penn State U of Illinois-Urbana Champaign Computer Programming Drexel University University at Buffalo QUANTITATIVE (13)
Biology Fairfield University University of Massachusetts Chemistry University of Iowa U of Wisconsin-Madison Astronomy U of Colorado-Boulder Psychology Cal Poly Pomona University of Dayton University of New Mexico U of Southern Maine Sociology IUPUI American Government U of Central Florida SCIENCE (5) SOCIAL SCIENCE (6)
HUMANITIES (6) • English Composition • Brigham Young University • Tallahassee CC • Spanish • Portland State University • University of Tennessee • Fine Arts • Florida Gulf Coast University • World Literature • University of Southern Mississippi
IMPROVED LEARNING OUTCOMES • Penn State - 68% on a content-knowledge test vs. 60% • UB - 56% earned A- or higher vs. 37% • CMU - scores on skill/concept tests increased by 22.8% • Fairfield – 88% on concept retention vs. 79% • U of Idaho – 30% earned A’s vs. 20% • UMass – 73% on tougher exams vs. 61% • FGCU - 85% on exams vs. 72%; 75% A’s and B’s vs. 31% • USM - scored a full point higher on writing assessments • IUPUI, RCC, UCF, U of S Maine, Drexel and U of Ala - significant improvements in understanding content 25 of 30 have shown improvement; 5 have shown equal learning.
REDUCTION IN DFW RATES • U of Alabama – 60% to 40% • Drexel – 51% to 38% • Tallahassee CC – 46% to 25% • Rio CC – 41% to 32% • IUPUI – 39% to 25% • UNM – 39% to 23% • U of S Maine – 28% to 19% • U of Iowa – 25% to 13% • Penn State – 12% to 9.8% 24 measured; 18 showed improvement.
COST SAVINGS RESULTS • Redesigned courses reduce costs by 37% on average, with a range of 15% to 77%. • Collectively, the 30 courses saved about $3 million annually.
WHAT HAPPENS TO THE SAVINGS? • Accommodate more students • Offer more options at the second-year or upper-division level • Develop distance learning courses and programs • Decrease time to graduation for students by eliminating academic bottlenecks • Free up expensive campus space
REDESIGN CHARACTERISTICS • Redesign the whole course—not just a single class • Emphasize active learning—greater student engagement with the material and with one another • Rely heavily on readily available interactive software—used independently and in teams • Increase on-demand, individualized assistance • Automate only those course components that can benefit from automation—e.g., homework, quizzes, exams • Replace single mode instruction with differentiated personnel strategies Technology enables good pedagogy with large #s of students.
GENERAL BIOLOGY at Fairfield University • Enhance quality by individualizing instruction • Focus on higher-level cognitive skills • Create both team-based and independent investigations • Use interactive learning environments in lectures and labs • to illustrate difficult concepts • to allow students to practice certain skills or test certain hypotheses • to work with other students to enhance the learning and discussion of complex topics Memorization vs. Application of Scientific Concepts
Traditional 7 sections (~35) 7 faculty 100% wet labs $131,610 $506 cost-per-student Redesign 2 sections (~140) 4 faculty 50% wet, 50% virtual $98,033 $350 cost-per-student • Content mastery: significantly better performance • Content retention: significantly better (88% vs. 79%) • Course drops declined from 8% to 3% • Next course enrollment increased from 75% to 85% • Declared majors increased by 4%
FIVE REDESIGN MODELS • Supplemental – Add to the current structure and/or change the content • Replacement – Blend face-to-face with online activities
FIRST-YEAR SPANISH at the University of Tennessee • Primary goal: Increase speaking skills • Reduce in-class time by 50% • Provide immediate feedback and support collaborative learning online • 1529 students @ $109 vs. 2052 students @ $28
FIVE REDESIGN MODELS • Supplemental – Add to the current structure and/or change the content • Replacement – Blend face-to-face with online activities • Emporium – Move all classes to a lab setting
Traditional 38 sections (~40) 10 tenured faculty, 13 instructors, 15 GTAs 2 hours per week $91 cost-per-student Redesign 1 section (~1520) 1 instructor, grad & undergrad TAs + 2 tech support staff 24*7 in open lab $21 cost-per-student THE MATH EMPORIUMat Virginia Tech Replicated at U of Alabama, U of Idaho, LSU, Wayne State, U Missouri-St. Louis, Seton Hall
THE EMPORIUM MODEL77% Cost Reduction (V1)30% Cost Reduction (V2)
Fall 1998 Fall 1999 Fall 2000 Fall 2001 Fall 2002 Fall 2003 Fall 2004 47.1% 40.6% 50.2% 60.5% 63.0% 78.9% 76.2% UNIVERSITY OF ALABAMASUCCESS RATES
FIVE REDESIGN MODELS • Supplemental – Add to the current structure and/or change the content • Replacement – Blend face-to-face with online activities • Emporium – Move all classes to a lab setting • Fully online – Conduct all (most) learning activities online
Traditional Redesign one class Emphasize instructor-to-student interaction Instructor does all grading and provides all student feedback Single personnel strategy Redesign Redesign whole course Emphasize student-to-student interaction and teaming Automate grading and student feedback Differentiated personnel strategy FULLY ONLINE MODELFine Arts, Literature, Math, Psychology
FIVE REDESIGN MODELS • Supplemental – Add to the current structure and/or change the content • Replacement – Blend face-to-face with online activities • Emporium – Move all classes to a lab setting • Fully online – Conduct all (most) learning activities online • Buffet – Mix and match according to student preferences
THE BUFFET MODEL • Assess each student’s knowledge/skill level and preferred learning style • Provide an array of high-quality, interactive learning materials and activities • Develop individualized study plans • Build in continuous assessment to provide practice and feedback • Offer appropriate, varied human interaction when needed
WHAT DO THE FACULTY SAY? • “It’s the best experience I’ve ever had in a classroom.” • “The quality of my worklife has changed immeasurably for the better.” • “It’s a lot of work during the transition--but it’s worth it.”
TAKING COURSE REDESIGN TO SCALE • The Roadmap to Redesign (R2R) • Lumina Study: Underserved Students • The Redesign Alliance • Colleagues Committed to Redesign (C2R) • Programs with Systems and States
Full project plans Monographs Progress reports Planning resources Lessons Learned Project contacts FOR MORE INFORMATIONwww.theNCAT.org
CAROL to CAROL at LSU in Spring 2005