Download
1 / 18
180 likes | 312 Views
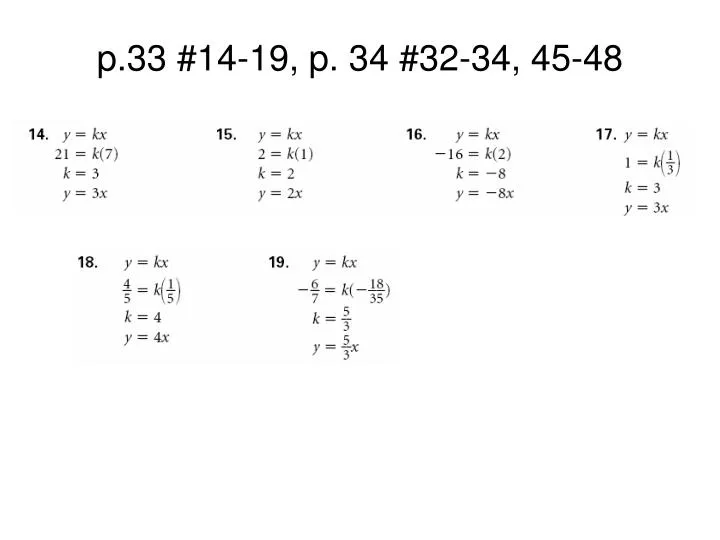
p.33 #14-19, p. 34 #32-34, 45-48. p.33 #14-19, p. 34 #32-34, 45-48. p.33 #14-19, p. 34 #32-34, 45-48. Lesson 1.5 - Scatter Plots and Least-Squares Lines. “Line of Best Fit” “Linear Regression Line” “Least Squares Line”. Three terms that mean the same thing.

E N D
“Line of Best Fit” “Linear Regression Line” “Least Squares Line” Three terms that mean the same thing
In many real-world problems, you will find data that relate 2 variables such as time and distance or age and height. You can view the relationship between 2 variables with a scatter plot.
There is a correlation between 2 variables when there appears to be a line about which the data points cluster. The diagram below shows some possible correlations.
Finding the Least-Squares Line A scatter plot can help you see patterns in data involving 2 variables. If you think there maybe a linear correlation between the variables, you can use a calculator to find a linear-regression line, also called a least-squares line, that best fits the data. STAT (L1, L2) STAT / CALC / LINREG
Correlation and Prediction • The correlation coefficient, denoted by r, indicates how closely the data points cluster around the least-squares line. • The correlation coefficient can vary from -1, which is a perfect fit for a negative correlation, to +1, which is a perfect fit for a positive correlation.
Each day last week, the manager of a movie theater recorded how many people attended a movie. He also recorded how many bags of popcorn were sold. 1) Is there is a correlation between these two sets of data? y= .62x – 23.46 r= .99 2) Use your regression model to predict the attendance at a movie during which 198 bags of popcorn were sold.
Homework Sheet 1.5 OR pp. 42 & 43: Do any two problems from among #22 to 25 • Quiz Tomorrow on Lessons 1.1 to 1.5