Download
1 / 99
1.01k likes | 1.22k Views
Relationships between Convectively Coupled Kelvin Waves and Extratropical Wave Activity. George N. Kiladis Klaus Weickmann Brant Liebmann NOAA, Physical Sciences Division Earth System Research Laboratory CIRES, University of Colorado.

E N D
Relationships between Convectively Coupled Kelvin Waves and Extratropical Wave Activity George N. Kiladis Klaus Weickmann Brant Liebmann NOAA, Physical Sciences Division Earth System Research Laboratory CIRES, University of Colorado
Or:Some (as yet only partially explained) observations of Kelvin Waves and Associated Extratropical Disturbances
Data Sources Cloud Archive User Services (CLAUS) Brightness Temperature 8 times daily, .5 resolution July 1983-September 2005 NCEP-NCAR Reanalysis products 4 times daily, 17 pressure levels, 2.5 resolution
Key Papers: Lindzen, R. D., 1967: Planetary waves on beta-planes. Mon. Wea. Rev. Hoskins, B. J. and T. Ambrizzi 1993: Rossby wave propagation on a realistic longitudinally varying flow. J. Atmos. Sci. Zhang, C. and P. J. Webster, 1989: Effects of zonal flows on equatorially-trapped waves. J. Atmos. Sci. Zhang, C. and P. J. Webster, 1992: Laterally forced equatorial perturbations in a linear model. J. Atmos. Sci. Yang, G. –Y. and B. J. Hoskins 1996: Propagation of Rossby waves of non-zero frequency. J. Atmos. Sci. Hoskins, B. J., and G. –Y. Yang, G. –Y. 2000: The equatorial response to higher latitude forcing. J. Atmos. Sci. Roundy, P. E., 2008: Analysis of convectively coupled Kelvin waves in the Indian Ocean MJO. J. Atmos. Sci. Dias, J. and O. Pauluis, 2009: Convectively coupled Kelvin waves propagating along an ITCZ. J. Atmos. Sci. Ferguson, J., B. Khouider, M. Namazi, 2009: Two-way interactions between equatorially-trapped waves and the barotropic flow. Chinese Ann. Math.
Theoretical Considerations:Effects of Meridional Shear in the Zonal Wind Differential advection leads to straining and deformation: Affects shape and group velocity Wave-guiding: Trapping of Rossby wave energy along jets, extratropical waves are guided towards low latitudes in certain regions Non-Doppler Effect: Meridional shear modifies the -effect, leading to differences in equivalent depths and equatorial trapping Critical Line: Where the zonal phase speed of a Rossby Wave equals that of the background zonal wind (waves are absorbed or perhaps reflected here).
200 hPa Climatological Zonal Wind, Dec.-Feb. 1979-2004 Contour interval 5 ms-1
200 hPa Climatological Zonal Wind, June-Aug. 1979-2004 Contour interval 5 ms-1
OLR and 200 hPa Flow Regressed against <30 day filtered OLR (scaled -20 W m2) at 10N, 150W for Dec.-Feb. 1979-2004 Day 0 Streamfunction (contours 5 X 10⁵ m2 s-1) Wind (vectors, largest around 10 ms-1) OLR (shading starts at +/- 6 W s-2), negative blue Kiladis, 1998
OLR and 200 hPa Flow Regressed against <30 day filtered OLR (scaled -20 W m2) at 10N, 150W for Dec.-Feb. 1979-2004 Day-5 Streamfunction (contours 5 X 10⁵ m2 s-1) Wind (vectors, largest around 10 ms-1) OLR (shading starts at +/- 6 W s-2), negative blue
OLR and 200 hPa Flow Regressed against <30 day filtered OLR (scaled -20 W m2) at 10N, 150W for Dec.-Feb. 1979-2004 Day-4 Streamfunction (contours 5 X 10⁵ m2 s-1) Wind (vectors, largest around 10 ms-1) OLR (shading starts at +/- 6 W s-2), negative blue
OLR and 200 hPa Flow Regressed against <30 day filtered OLR (scaled -20 W m2) at 10N, 150W for Dec.-Feb. 1979-2004 Day-3 Streamfunction (contours 5 X 10⁵ m2 s-1) Wind (vectors, largest around 10 ms-1) OLR (shading starts at +/- 6 W s-2), negative blue
OLR and 200 hPa Flow Regressed against <30 day filtered OLR (scaled -20 W m2) at 10N, 150W for Dec.-Feb. 1979-2004 Day-2 Streamfunction (contours 5 X 10⁵ m2 s-1) Wind (vectors, largest around 10 ms-1) OLR (shading starts at +/- 6 W s-2), negative blue
OLR and 200 hPa Flow Regressed against <30 day filtered OLR (scaled -20 W m2) at 10N, 150W for Dec.-Feb. 1979-2004 Day-1 Streamfunction (contours 5 X 10⁵ m2 s-1) Wind (vectors, largest around 10 ms-1) OLR (shading starts at +/- 6 W s-2), negative blue
OLR and 200 hPa Flow Regressed against <30 day filtered OLR (scaled -20 W m2) at 10N, 150W for Dec.-Feb. 1979-2004 Day 0 Streamfunction (contours 5 X 10⁵ m2 s-1) Wind (vectors, largest around 10 ms-1) OLR (shading starts at +/- 6 W s-2), negative blue
OLR and 200 hPa Flow Regressed against <30 day filtered OLR (scaled -20 W m2) at 10N, 150W for Dec.-Feb. 1979-2004 Day+1 Streamfunction (contours 5 X 10⁵ m2 s-1) Wind (vectors, largest around 10 ms-1) OLR (shading starts at +/- 6 W s-2), negative blue
OLR and 200 hPa Flow Regressed against <30 day filtered OLR (scaled -20 W m2) at 10N, 150W for Dec.-Feb. 1979-2004 Day+2 Streamfunction (contours 5 X 10⁵ m2 s-1) Wind (vectors, largest around 10 ms-1) OLR (shading starts at +/- 6 W s-2), negative blue
OLR and 200 hPa Flow Regressed against <30 day filtered OLR (scaled -20 W m2) at 7.5N, 30W for Dec.-Feb. 1979-2004 Day-2 Streamfunction (contours 5 X 10⁵ m2 s-1) Wind (vectors, largest around 10 ms-1) OLR (shading starts at +/- 6 W s-2), negative blue Kiladis and Weickmann, 1997
OLR and 200 hPa Flow Regressed against <30 day filtered OLR (scaled -20 W m2) at 7.5N, 30W for Dec.-Feb. 1979-2004 Day-1 Streamfunction (contours 5 X 10⁵ m2 s-1) Wind (vectors, largest around 10 ms-1) OLR (shading starts at +/- 6 W s-2), negative blue
OLR and 200 hPa Flow Regressed against <30 day filtered OLR (scaled -20 W m2) at 7.5N, 30W for Dec.-Feb. 1979-2004 Day 0 Streamfunction (contours 5 X 10⁵ m2 s-1) Wind (vectors, largest around 10 ms-1) OLR (shading starts at +/- 6 W s-2), negative blue
OLR and 200 hPa Flow Regressed against <30 day filtered OLR (scaled -20 W m2) at 7.5N, 30W for Dec.-Feb. 1979-2004 Day+1 Streamfunction (contours 5 X 10⁵ m2 s-1) Wind (vectors, largest around 10 ms-1) OLR (shading starts at +/- 6 W s-2), negative blue
OLR and 200 hPa Flow Regressed against <30 day filtered OLR (scaled -20 W m2) at 7.5N, 30W for Dec.-Feb. 1979-2004 Day+2 Streamfunction (contours 5 X 10⁵ m2 s-1) Wind (vectors, largest around 10 ms-1) OLR (shading starts at +/- 6 W s-2), negative blue
OBSERVATIONS OF KELVIN AND INERTIO-GRAVITY WAVES CLAUS Brightness Temperature (2.5S–7.5N), April-May 1987
OBSERVATIONS OF KELVIN AND INERTIO-GRAVITY WAVES CLAUS Brightness Temperature (2.5S–7.5N), April-May 1987 28 ms-1
OLR and 850 hPa Flow Regressed against Kelvin-filtered OLR (scaled -20 W m2) at 7.5N, 172.5W for June-Aug. 1983-2005 Day+1 Geopotential Height (contours .5 m) Wind (vectors, largest around 5 ms-1) OLR (shading starts at +/- 6 W s-2), negative blue Straub and Kiladis, 1997
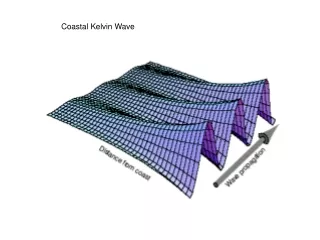
Kelvin Wave Theoretical Structure Wind, Pressure (contours), Divergence, blue negative
OLR and 850 hPa Flow Regressed against Kelvin-filtered OLR (scaled -20 W m2) at 7.5N, 172.5W for June-Aug. 1983-2005 Day+1 Streamfunction (contours 2 X 10⁵ m2 s-1) Wind (vectors, largest around 2 ms-1) OLR (shading starts at +/- 6 W s-2), negative blue
OLR and 200 hPa Flow Regressed against Kelvin-filtered OLR (scaled -20 W m2) at 7.5N, 172.5W for June-Aug. 1983-2005 Day+1 Streamfunction (contours 2 X 10⁵ m2 s-1) Wind (vectors, largest around 2 ms-1) OLR (shading starts at +/- 6 W s-2), negative blue
OLR and 200 hPa Flow Regressed against Kelvin-filtered OLR (scaled -20 W m2) at 7.5N, 172.5W for June-Aug. 1983-2005 Day-6 Streamfunction (contours 2 X 10⁵ m2 s-1) Wind (vectors, largest around 2 ms-1) OLR (shading starts at +/- 6 W s-2), negative blue
OLR and 200 hPa Flow Regressed against Kelvin-filtered OLR (scaled -20 W m2) at 7.5N, 172.5W for June-Aug. 1983-2005 Day-5 Streamfunction (contours 2 X 10⁵ m2 s-1) Wind (vectors, largest around 2 ms-1) OLR (shading starts at +/- 6 W s-2), negative blue
OLR and 200 hPa Flow Regressed against Kelvin-filtered OLR (scaled -20 W m2) at 7.5N, 172.5W for June-Aug. 1983-2005 Day-4 Streamfunction (contours 2 X 10⁵ m2 s-1) Wind (vectors, largest around 2 ms-1) OLR (shading starts at +/- 6 W s-2), negative blue
OLR and 200 hPa Flow Regressed against Kelvin-filtered OLR (scaled -20 W m2) at 7.5N, 172.5W for June-Aug. 1983-2005 Day-3 Streamfunction (contours 2 X 10⁵ m2 s-1) Wind (vectors, largest around 2 ms-1) OLR (shading starts at +/- 6 W s-2), negative blue
OLR and 200 hPa Flow Regressed against Kelvin-filtered OLR (scaled -20 W m2) at 7.5N, 172.5W for June-Aug. 1983-2005 Day-2 Streamfunction (contours 2 X 10⁵ m2 s-1) Wind (vectors, largest around 2 ms-1) OLR (shading starts at +/- 6 W s-2), negative blue
OLR and 200 hPa Flow Regressed against Kelvin-filtered OLR (scaled -20 W m2) at 7.5N, 172.5W for June-Aug. 1983-2005 Day-1 Streamfunction (contours 2 X 10⁵ m2 s-1) Wind (vectors, largest around 2 ms-1) OLR (shading starts at +/- 6 W s-2), negative blue
OLR and 200 hPa Flow Regressed against Kelvin-filtered OLR (scaled -20 W m2) at 7.5N, 172.5W for June-Aug. 1983-2005 Day 0 Streamfunction (contours 2 X 10⁵ m2 s-1) Wind (vectors, largest around 2 ms-1) OLR (shading starts at +/- 6 W s-2), negative blue
OLR and 200 hPa Flow Regressed against Kelvin-filtered OLR (scaled -20 W m2) at 7.5N, 172.5W for June-Aug. 1983-2005 Day+1 Streamfunction (contours 2 X 10⁵ m2 s-1) Wind (vectors, largest around 2 ms-1) OLR (shading starts at +/- 6 W s-2), negative blue
OLR and 200 hPa Flow Regressed against Kelvin-filtered OLR (scaled -20 W m2) at 7.5N, 172.5W for June-Aug. 1983-2005 Day+2 Streamfunction (contours 2 X 10⁵ m2 s-1) Wind (vectors, largest around 2 ms-1) OLR (shading starts at +/- 6 W s-2), negative blue
OLR and 200 hPa Flow Regressed against Kelvin-filtered OLR (scaled -20 W m2) at 7.5N, 172.5W for June-Aug. 1983-2005 Day+3 Streamfunction (contours 2 X 10⁵ m2 s-1) Wind (vectors, largest around 2 ms-1) OLR (shading starts at +/- 6 W s-2), negative blue
OLR and 200 hPa Flow Regressed against Kelvin-filtered OLR (scaled -20 W m2) at 7.5N, 172.5W for June-Aug. 1983-2005 Day+4 Streamfunction (contours 2 X 10⁵ m2 s-1) Wind (vectors, largest around 2 ms-1) OLR (shading starts at +/- 6 W s-2), negative blue
OLR and 200 hPa Flow Regressed against Kelvin-filtered OLR (scaled -20 W m2) at 7.5N, 172.5W for June-Aug. 1983-2005 Day-10 Streamfunction (contours 2 X 10⁵ m2 s-1) Wind (vectors, largest around 2 ms-1) OLR (shading starts at +/- 6 W s-2), negative blue
OLR and 200 hPa Flow Regressed against Kelvin-filtered OLR (scaled -20 W m2) at 7.5N, 172.5W for June-Aug. 1983-2005 Day-9 Streamfunction (contours 2 X 10⁵ m2 s-1) Wind (vectors, largest around 2 ms-1) OLR (shading starts at +/- 6 W s-2), negative blue
OLR and 200 hPa Flow Regressed against Kelvin-filtered OLR (scaled -20 W m2) at 7.5N, 172.5W for June-Aug. 1983-2005 Day-8 Streamfunction (contours 2 X 10⁵ m2 s-1) Wind (vectors, largest around 2 ms-1) OLR (shading starts at +/- 6 W s-2), negative blue
OLR and 200 hPa Flow Regressed against Kelvin-filtered OLR (scaled -20 W m2) at 7.5N, 172.5W for June-Aug. 1983-2005 Day-7 Streamfunction (contours 2 X 10⁵ m2 s-1) Wind (vectors, largest around 2 ms-1) OLR (shading starts at +/- 6 W s-2), negative blue
OLR and 200 hPa Flow Regressed against Kelvin-filtered OLR (scaled -20 W m2) at 7.5N, 172.5W for June-Aug. 1983-2005 Day-6 Streamfunction (contours 2 X 10⁵ m2 s-1) Wind (vectors, largest around 2 ms-1) OLR (shading starts at +/- 6 W s-2), negative blue
OLR and 200 hPa Flow Regressed against Kelvin-filtered OLR (scaled -20 W m2) at Eq., 90E for June-Aug. 1983-2005 Day 0 Streamfunction (contours 2 X 10⁵ m2 s-1) Wind (vectors, largest around 2 ms-1) OLR (shading starts at +/- 6 W s-2), negative blue
OLR and 200 hPa Flow Regressed against Kelvin-filtered OLR (scaled -20 W m2) at Eq., 90E for March-May 1983-2005 Day 0 Streamfunction (contours 2 X 10⁵ m2 s-1) Wind (vectors, largest around 2 ms-1) OLR (shading starts at +/- 6 W s-2), negative blue
OLR and 200 hPa Flow Regressed against Kelvin-filtered OLR (scaled -20 W m2) at Eq., 90E for Dec.-Jan. 1983-2005 Day 0 Streamfunction (contours 2 X 10⁵ m2 s-1) Wind (vectors, largest around 2 ms-1) OLR (shading starts at +/- 6 W s-2), negative blue
OLR and 200 hPa Flow Regressed against <30 day filtered OLR (scaled -20 W m2) at 7.5N, 30W for Dec.-Feb. 1979-2004 Day 0 Streamfunction (contours 5 X 10⁵ m2 s-1) Wind (vectors, largest around 10 ms-1) OLR (shading starts at +/- 6 W s-2), negative blue
OLR and 200 hPa Flow Regressed against Kelvin-filtered OLR (scaled -20 W m2) at 2.5N, 0.0 for March-May 1983-2005 Day-1 Streamfunction (contours 2 X 10⁵ m2 s-1) Wind (vectors, largest around 2 ms-1) OLR (shading starts at +/- 6 W s-2), negative blue
OLR and 200 hPa Flow Regressed against Kelvin-filtered OLR (scaled -20 W m2) at 2.5N, 0.0 for March-May 1983-2005 Day+1 Streamfunction (contours 2 X 10⁵ m2 s-1) Wind (vectors, largest around 2 ms-1) OLR (shading starts at +/- 6 W s-2), negative blue