Download
1 / 33
330 likes | 421 Views
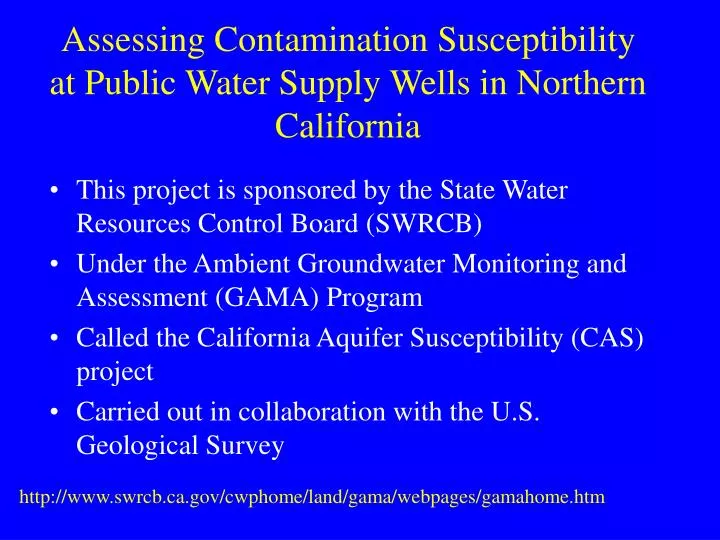
Assessing Contamination Susceptibility at Public Water Supply Wells in Northern California. This project is sponsored by the State Water Resources Control Board (SWRCB) Under the Ambient Groundwater Monitoring and Assessment (GAMA) Program

E N D
Assessing Contamination Susceptibility at Public Water Supply Wells in Northern California • This project is sponsored by the State Water Resources Control Board (SWRCB) • Under the Ambient Groundwater Monitoring and Assessment (GAMA) Program • Called the California Aquifer Susceptibility (CAS) project • Carried out in collaboration with the U.S. Geological Survey http://www.swrcb.ca.gov/cwphome/land/gama/webpages/gamahome.htm
California Groundwater Vulnerability Number of Leaking Underground Fuel Tank (LUFT) Sites Within 1/2 Mile of a water supply well CAS Project Takes a probablistic approach in assessing relative contamination susceptibility 4-9 LUFT sites within 1/2 mile
The Question • Will contaminants present at and near the surface reach drinking water supply wells? The Tools • Oxygen isotopes (water source) • Ultra low level Volatile Organic Compound analysis (part per trillion detection limits) • Groundwater Age (Tritium-Helium method)
The ratio of 18O to 16O in precipitation varies because lighter 16O is favored during evaporation while 18O is favored during condensation. The map shows the value of 18O/16O relative to seawater in parts per thousand
Stable isotopes of the water molecule are good indicators of water source in California The isotopic signatures of the large, perennial Rivers with Sierran headwaters are distinct from locally-sourced water in the Central Valley
d18O Ranges and End Members • Northern Sacramento Valley Precipitation: -8 (volume weighted, time-integrated) • High Elevation Sierra Precipitation: -14 • Range in measured rain/snow samples: -4.4 to -22.8 • Surface Water: • Sacramento River above Shasta -13.3 (3), below Shasta -10.8 (12), Feather River -11.0 (2) • Wild Goose Canal: -10.6 • McCloud River: -12.4 (3), Pit River: -13.0 (3), Fall River: -13.5 (2), Susan River: -13.1 (2), Burney Falls: -13.0 (3) • Lake Davis: -5.7 • Range in GAMA northern CA study groundwaters: -14.7 (Weed) to -6.0 (Durham Esquon shallow monitoring well)
Advantages You get a good, clean sample (both dissolved gases and low level VOCs) Characteristics are usually known It’s the water people are using and drinking Disadvantages Vertical information is smeared ‘Signal’ is diluted Flow field is altered It’s the water people are drinking Results are from Long-screened Production Wells
Assessing Groundwater Vulnerability Type(s) of VOCs detected, and age analysis including mixing, give additional information about transport.
Sample Statistics and Fun Facts • 168 samples • 121 public supply, 39 monitoring wells, 6 private wells, 2 springs • 74 (44%) with < 3 pCi/L tritium • 47 (28%) with < 1 pCi/L • 18 with clear mantle He component • 51/123 (41%) MtBE hits (30 in Chico); 4 > 51 ppt (2 Portola, 1 Alturas, 1 Chico) • 3 BTEX hits (Dorris, Chico, Weed) • 55/123 (45%) PCE hits (47 in Chico) • 23 TCE hits (19 in Chico) • 5 1,1,1TCA hits (Chico, Orland, Portola) • 2 DBCP hits (Chico and Gridley)
The ‘river recharge’ phenomenon occurs all along the Central Valley
N = 606 Analyte < Reporting Limit > Reporting Limit > 50 ppt >500 ppt MtBE 450 156 28 3 BTEX 599 71 22 13 PCE 405 201 80 23 TCE 510 96 34 9 CHCl3 249 357 140 26 DBCP 582 24 15 3 All VOCs4 180 426 1 5 samples had all four BTEX compounds, an additional 2 samples had toluene, ethylbenzene and o-xylene or m,p-xylene detections without benzene 2At least one of the BTEX analytes was detected at a concentration > 50 ppt 3One toluene detection of 750 ppt 4Analytes listed in Table 1; sample had <RL for all compounds or >RL for at least one compound
Coastal Basins1 N=194 Central Valley Basins2 N=338 No VOCs3 105 (54%) 48 (14%) MtBE 29 (15%) 87 (25%) PCE 18 (9%) 166 (49%) CHCl3 68 (35%) 252 (74%) 11 Includes Santa Clara Valley, Basins of San Mateo County (San Mateo Plain, Westside Basin and Coastside Basin), Livermore-Amador Basin, and Niles Cone (Fremont, CA) 22 Includes Bakersfield, Chico and surrounding northern Sacramento Valley, Sacramento, and San Joaquin County urban areas (Stockton, Lodi, and Manteca); wells from areas outside of alluvial basins are not included on this table 3 3 Samples had <RL for all compounds listed in Table 1
VOC Statistics • 51/123 (41%) MtBE hits (30 in Chico); 4 > 51 ppt (2 Portola, 1 Alturas, 1 Chico) • 3 BTEX hits (Dorris, Chico, Weed) • 55/123 (45%) PCE hits (47 in Chico) • 23 TCE hits (19 in Chico) • 5 1,1,1TCA hits (Chico, Orland, Portola) • 2 DBCP hits (Chico and Gridley)
Conclusions • River water is an important source of recharge for a large portion of the study area • A large volume of ‘old’ (pre-modern) groundwater is produced at drinking water wells • Low-level contamination is widespread in Chico, and reaches deep, old groundwater • Paleowater is present in deep aquifers on the western side of the valley