Download
1 / 11
110 likes | 222 Views
RECORDING LAND IN THE NATIONAL BALANCE SHEET. Kirsty Leslie London Group Meeting Wiesbaden, 30 November - 4 December 2009. Overview. Land in the Australian National Balance Sheet ABS approach to measuring land values Estimating land degradation - experimental estimates for Australia

E N D
RECORDING LAND IN THE NATIONAL BALANCE SHEET Kirsty Leslie London Group Meeting Wiesbaden, 30 November - 4 December 2009
Overview • Land in the Australian National Balance Sheet • ABS approach to measuring land values • Estimating land degradation - experimental estimates for Australia • The 2008 SNA and implications for the revised SEEA
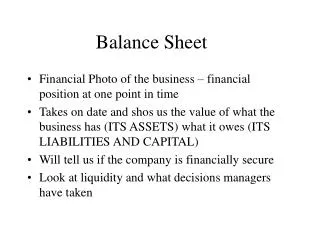
Balance sheets • Balance sheets are a useful tool in the assessment of national well-being • Balance sheets include the value of assets in scope of the SNA • Some economic assets are also environmental assets • environmental capital and economic capital overlap • In SNA balance sheets only the economic values are included • environmental value above economic value not included • Therefore the scope is narrower than SEEA
Land in the balance sheet • Where valuation of land is shown on the national balance sheet, land invariably emerges as a very significant component of national wealth • But very few countries publish estimates for the value of land Country comparison – land component of non-financial assets
Valuing residential land ABS Census of Population and Households Valuers-General Contractor (Australian Property Monitors) Elemental sales data RBA Mean sales data Dwelling count Residental land and dwelling stock ($) 92% to Household sector (published by RBA) 8% to Other sectors ABS Residental land + dwelling stock ($) for all sectors Minus ABS estimate of household capital stock of dwellings Scaled back up to 100% minus ABS estimate of capital stock of dwellings for all sectors Total residential land ($) Minus Household Residential land Household residental land ($) Residual assigned to NFC and GG * * NFC and GG split using data from the Valuers-General and Public Finance
Estimating land, Australia, 2006-07($ billion, current prices) Source: ABS National Accounts balance sheet compilation data
Measuring the volume of land • The Australian National Accounts includes commercial land as productive capital stock in its models for capital productivity and multi-factor productivity • Balance sheets are compiled on the basis that land volumes do change over time • Volume change may result from both changes in physical quantity and changes in quality • Physical land area of a country changes little over time • But, "It is generally assumed in economic analysis that whenever a difference in price is found between two goods and services that appear to be physically identical there must be some other factor, such as location, timing or conditions of sale, that is introducing a difference in quality". (2008 SNA, para 15.67) • Effects include land degradation, deforestation, reforestation, land improvement and rezoning
Estimating land degradation - experimental estimates for Australia • Kemp and Connell (2001) combined data from a farm survey with land value data to estimate the difference in the capital value of farms with and without degradation at $14.2 billion in 1999 • to estimate the year to year change in land value due to degradation, the ABS assumed that degradation accrued at a constant rate over the past 50 years ($14.2 billion / 50 = $284 million pa), and will continue at this rate into the future, i.e. $284 million pa (in 1999 dollar terms)
Estimating land degradation - experimental estimates for Australia (2) • The National Land and Water Resources Audit (2002), used models to estimate the lost profit at full equity (PFE) due to soil degradation at $2.6 billion in 1996–97 • The return to the owner for the use of the produced capital (63%) is removed from the PFE using ratios from the National Accounts. • The lost resource rent is 37% of PFE, or $947 million. • The NPV of the resource rents foregone is calculated using the real long term government bond rate (5.8%) and equals $16.4 billion. • This represents the value of land that has been lost due to land degradation • To estimate the year to year change in land value due to degradation, it was again assumed that degradation accrued at a constant rate over the past 50 years i.e. $16.4 billion / 50 = $329 million pa (in 1997 dollar terms)
Depletion-adjusted GDP, Australia ($ million, current prices) Source: Australia’s Environment: Issues and Trends 2007, ABS (Cat. no. 4613.0)
The 2008 SNA and implications for the revised SEEA • Revised SEEA and the 2008 SNA should remain consistent unless there are compelling reasons for departure • Under the 2008 SNA • asset classification has ‘Land’ (AN211) under the broader category ‘Natural resources’ (AN21) • land improvements are still gross fixed capital formation, but in the balance sheet are now a fixed asset ‘Land improvements’ (AN1123), distinct from ‘Land’ (AN211) • the costs of ownership transfer on land are still a fixed asset, but in the balance sheet there is now a ‘costs of ownership transfer on non-produced assets’ (AN116), separate from the associated non-produced asset of ‘Land’