Download
1 / 29
290 likes | 386 Views
Troubleshooting Performance. Oracle Tutorials Luca Canali, Dawid Wojcik CERN, May 27 th , 2013. Outline. Part1 Introduction Get the design right Get the development processes Tuning by understanding The role of profiling Part2 Understanding execution plans Tools .

E N D
Troubleshooting Performance Oracle Tutorials Luca Canali, Dawid Wojcik CERN, May 27th, 2013
Outline • Part1 • Introduction • Get the design right • Get the development processes • Tuning by understanding • The role of profiling • Part2 • Understanding execution plans • Tools Oracle Tutorials, Troubleshooting Performance
Why Performance Tuning? • Need faster interaction between application and database • Help DB engine to better serve your needs • Why is it relevant and interesting? • Performance can be highly visible in critical projects • It’s about resources usage optimisation • Performance tuning requires logical thinking, systematic approach and creativity Oracle Tutorials, Troubleshooting Performance
Examples • Examples of cases that stress database engine performance: • High rate of concurrent transactions • High rate of queries • Queries that scan large amounts of data • Complex joins and aggregations on data • Strict requirements on response time Oracle Tutorials, Troubleshooting Performance
Proactive Tuning - Design • Design phase • Foundations for future performance • Example • Define logical and physical structure of the table • Define which tables to use, which indexes, etc • Typical mistake • requirements change after design and we are stuck with suboptimal DB structure • Critical: • Involve application owner (get the use case right) • involve DB experts Oracle Tutorials, Troubleshooting Performance
DEMO 1 • Data access paths - get the indexes right Oracle Tutorials, Troubleshooting Performance
Guidelines • We are going to explore tools and techniques in this tutorial • However much tuning can be done before touching SQL! • Understand how final users will access data • Understand how Oracle (or any other DB) could execute our SQL Oracle Tutorials, Troubleshooting Performance
How many DBs do you need? • Development Lifecycle • Development DB • Pre-production tests (integration DB) • Stress testing (test DB) • Production (reactive tuning) • In other words: • We promote extensive tests • Tests done in a production-like environment • Test with realistic size of data • Test with concurrent users Oracle Tutorials, Troubleshooting Performance
Guidelines Oracle Tutorials, Troubleshooting Performance
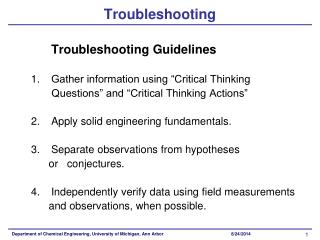
Systematic Approach • Example: • Have a clear view of what is the final goal • A good goal is something that matters to the end-users • Define the scope of the problem • Drilldown to the problem-area • Build a mental model of what is happening • Which parts are involved? How do they interact? • Perform tests and relevant measurements • Where is time spent? Are there bottlenecks? • Confirm or disprove the model, check the goal • Possibly propose change(s) + further testing Oracle Tutorials, Troubleshooting Performance
Lateral Thinking • A different path to the same goal • Turn the problem around as opposed to tune the sub-steps one by one • How to make it work. Example: • Have a clear understanding of the use case • Build a model of what is happening in the application and in Oracle • i.e. understand why the implementation doesn’t perform • Know enough of the application and Oracle to get to the goal via a different path • Know who to involve/ask for help Oracle Tutorials, Troubleshooting Performance
Oracle is Instrumented • Oracle database access is heavily instrumented • It is not a black box! • Basic idea: • It is possible to know what Oracle is doing at a given time • Example: • It is possible to measure where time is spent • On which SQL statement • On what part of the SQL execution • How much time is spent on CPU • How much time is spent waiting for disk access, etc Oracle Tutorials, Troubleshooting Performance
Profiling Execution • What we want to achieve • Find out where time is spent during execution • Drill down on the relevant code part • Profile your code in the relevant parts • Some times this is slower than actual Oracle SQL time • Profile Oracle execution • Time-based details of SQL, CPU usage, I/O, etc • Tools and techniques • More details in Part2 • This includes, execution plan, SQL traces, OEM Oracle Tutorials, Troubleshooting Performance
Finding Bottlenecks • There is always a limiting factor • Measurements can show if and where it is on DB access • Detail time spent by DB processing to find bottlenecks • Examples: • IO read time (throughput) • IO random read time (latency) • Lock contention (transactional wait) • CPU time for SQL execution Oracle Tutorials, Troubleshooting Performance
DEMO 2 • SQL autotrace • Dbms_application_info • Lock contention Oracle Tutorials, Troubleshooting Performance
Weekend read suggestion • The Goal, a novel but also a great introduction to the theory of constraints! • Spoiler: a physicist gets to be ‘the hero’ Oracle Tutorials, Troubleshooting Performance
Part 2 • Execution plans • Stats gathering • Tools for performance troubleshooting Oracle Tutorials, Troubleshooting Performance
Why execution plans? • Execution plans • Are the representation of the route Oracle takes from data to end result • Why bother? • Do you always trust your GPS? Oracle Tutorials, Troubleshooting Performance
Execution plans • Execution plan • Text or graphical representation of stepsOracle server takes to execute specific SQL • Execution plan is a tree in which every nodeis a DB server operation • Prepared during hard parsing of a statement and kept inside library cache • There can be multiple execution plans for the same query • Depending on bind variables • Depending on statistics • Depending on hints • Plans may change when they age out of library cache (new hard parse required) • An explain plan might be different than actual execution plan • NESTEDLOOPS • TABLE ACCESS BY INDEX ROWID • TABLEACCESS FULL • INDEX UNIQUE SCAN
Reading execution plans • Few simplerules of reading execution plans • Parent operations get input only from their children (data sources) • Data access starts from the first line without children • Rows are “sent” upwards to parent data sources in cascading fashion select d.dname, d.loc, e.empno, e.ename from emp e, dept d where e.deptno = d.deptno and d.dname = 'SALES‘ and e.ename between 'A%' and 'X%‘ order by e.deptno; ---------------------------------------------------------------------------- | Id | Operation | Name | Rows | Bytes | Cost (%CPU)| Time | ---------------------------------------------------------------------------- | 0 | SELECT STATEMENT | | 5 | 315 | 8 (25)| 00:00:01 | | 1 | SORT ORDER BY | | 5 | 315 | 8 (25)| 00:00:01 | |* 2 | HASH JOIN | | 5 | 315 | 7 (15)| 00:00:01 | |* 3 | TABLE ACCESS FULL| DEPT | 1 | 30 | 3 (0)| 00:00:01 | |* 4 | TABLE ACCESS FULL| EMP | 14 | 462 | 3 (0)| 00:00:01 | ---------------------------------------------------------------------------- Predicate Information (identified by operation id): --------------------------------------------------- 2 - access("E"."DEPTNO"="D"."DEPTNO") 3 - filter("D"."DNAME"='SALES') 4 - filter("E"."ENAME">='A%' AND "E"."ENAME"<='X%') • SELECT STATEMENT • SORTORDER BY • HASH JOIN • TABLE ACCESS FULL(DEPT) • TABLE ACCESS FULL(EMP)
Reading execution plans select name as "name", coalesce(sum("pending"),0) "pending", coalesce(sum("running"),0) "running", coalesce(sum("unknown"),0) "unknown", coalesce(sum("terminated"),0) "terminated", coalesce(sum("done"),0) "done", coalesce(sum("canc"),0) "cancelled", coalesce(sum("abort"),0) "aborted",coalesce(sum("apps"),0) "app-succeeded" , coalesce(sum("applic-failed"),0) "applic-failed",coalesce(sum("site-failed"),0) "site-failed",coalesce(sum("user-failed"),0) "user-failed",coalesce(sum("unk-failed"),0) "unk-failed", coalesce(sum("site-calc-failed"),0) "site-calc-failed", coalesce(sum("NEvProc"),0) "events", coalesce(sum("ExeCPU"),0) "cpu", coalesce(sum("WrapWC"),0) "wc", coalesce(sum("allunk"),0) as "allunk", coalesce(sum("UnSuccess"),0) as "unsuccess“ from ( select short_ce."ShortCEName" as name, decode ("DboardStatusId", 'T', decode(JOB."DboardGridEndId",'D',1,0)) "done", decode(JOB."DboardStatusId",'R',1,0) "running", decode(JOB."DboardStatusId",'T',1,0) "terminated", decode(JOB."DboardStatusId",'P',1,0) "pending", decode("DboardStatusId", 'U', 1, 0) as "unknown", decode ("DboardStatusId", 'T', decode(JOB."DboardGridEndId",'C',1,0)) as "canc", decode ("DboardStatusId", 'T', decode(JOB."DboardGridEndId",'A',1,0)) as "abort", decode ("DboardStatusId", 'T', decode(JOB."DboardJobEndId",'S',1,0)) as "apps", decode ("DboardStatusId", 'T', decode ("DboardJobEndId", 'F', decode("SiteUserFlag", 'application', 1, 0))) as "applic-failed", decode ("DboardStatusId", 'T', decode ("DboardJobEndId", 'F', decode("SiteUserFlag", 'site', 1, 0))) as "site-failed", decode ("DboardStatusId", 'T', decode ("DboardJobEndId", 'F', decode("SiteUserFlag", 'user', 1, 0))) as "user-failed", decode ("DboardStatusId", 'T', decode ("DboardJobEndId", 'F', decode("SiteUserFlag", 'unknown', 1, 0))) as "unk-failed", decode ("DboardStatusId", 'T', decode ("DboardJobEndId", 'F', decode("SiteUserFlag", 'site', 1, 0))) as "site-calc-failed", decode ("DboardStatusId", 'T', decode (JOB."DboardGridEndId", 'U', decode(JOB."DboardJobEndId", 'U', 1, 0))) as "allunk", decode ("DboardStatusId", 'T', coalesce("NEvProc",0)) as "NEvProc", decode ("DboardStatusId", 'T', decode("ExeCPU",0,(decode(sign("WrapCPU"),1,"WrapCPU",0)),"ExeCPU")) as "ExeCPU", decode ("DboardStatusId", 'T', coalesce("WrapWC",0)) as "WrapWC", decode(JOB."DboardJobEndId",'S',(decode(JOB."DboardGridEndId",'C',1,'A',1,0)),0) as "UnSuccess“ fromJOB,TASK, TASK_TYPE ,short_ce,site, APP_GENERIC_STATUS_REASONwhere JOB."TaskId"=TASK."TaskId" and TASK."TaskTypeId" = TASK_TYPE."TaskTypeId" and JOB."ShortCEId" = short_ce."ShortCEId" and job."SiteId" = site."SiteId" and JOB."JobExecExitCode" = APP_GENERIC_STATUS_REASON."AppGenericErrorCode" (+) and (("FinishedTimeStamp" <= :bv_date2 and "FinishedTimeStamp" >= :bv_date1 AND "DboardStatusId" = 'T' AND "DboardFirstInfoTimeStamp" >= cast(:bv_date1 AS TIMESTAMP) - interval '14' day) OR ("DboardStatusId" in ('P','R') AND "DboardFirstInfoTimeStamp" >= cast(:bv_date1 AS TIMESTAMP) - interval '14' day)) and task_type."NewType" = :bv_activity and site."VOName" = :bv_site order by short_ce."ShortCEName") group by name order by "pending"+"running"+"unknown"+"terminated" desc; ------------------------------------------------------------------------------------------------------------------------------------------- | Id | Operation | Name | Rows | Bytes | Cost (%CPU)| Time | Pstart| Pstop | ------------------------------------------------------------------------------------------------------------------------------------------- | 0 | SELECT STATEMENT | | | | 36975 (100)| | | | | 1 | SORT ORDER BY | | 1 | 142 | 36975 (1)| 00:05:51 | | | | 2 | HASH GROUP BY | | 1 | 142 | 36975 (1)| 00:05:51 | | | | 3 | NESTED LOOPS | | | | | | | | | 4 | NESTED LOOPS | | 1 | 142 | 36973 (1)| 00:05:51 | | | | 5 | NESTED LOOPS OUTER | | 1 | 115 | 36972 (1)| 00:05:51 | | | |* 6 | HASH JOIN | | 1 | 100 | 36971 (1)| 00:05:51 | | | | 7 | NESTED LOOPS | | 4 | 344 | 36969 (1)| 00:05:51 | | | | 8 | NESTED LOOPS | | 4 | 304 | 36961 (1)| 00:05:51 | | | | 9 | TABLE ACCESS BY INDEX ROWID | SITE | 1 | 16 | 2 (0)| 00:00:01 | | | |* 10 | INDEX RANGE SCAN | VONAME_IDX | 1 | | 1 (0)| 00:00:01 | | | |* 11 | TABLE ACCESS BY GLOBAL INDEX ROWID| JOB | 4 | 240 | 36959 (1)| 00:05:51 | ROWID | ROWID | |* 12 | INDEX RANGE SCAN | JOB_SITEID_IDX | 224K| | 1810 (1)| 00:00:18 | | | |* 13 | INDEX RANGE SCAN | TASK_ID_TYPEID | 1 | 10 | 2 (0)| 00:00:01 | | | |* 14 | TABLE ACCESS FULL | TASK_TYPE | 2 | 28 | 2 (0)| 00:00:01 | | | | 15 | TABLE ACCESS BY INDEX ROWID | APP_GENERIC_STATUS_REASON | 1 | 15 | 1 (0)| 00:00:01 | | | |* 16 | INDEX UNIQUE SCAN | PK_APP_GENERIC_STATUS_REASON | 1 | | 0 (0)| | | | |* 17 | INDEX UNIQUE SCAN | PK_SHORT_CE_NAME | 1 | | 0 (0)| | | | | 18 | TABLE ACCESS BY INDEX ROWID | SHORT_CE | 1 | 27 | 1 (0)| 00:00:01 | | | ------------------------------------------------------------------------------------------------------------------------------------------- … 100 more lines with predicates …
Reading execution plans ----------------------------------------------------------------------------------- | Id | Operation | Name | ----------------------------------------------------------------------------------- | 0 | SELECT STATEMENT | | | 1 | SORT ORDER BY | | | 2 | HASH GROUP BY | | | 3 | NESTED LOOPS | | | 4 | NESTED LOOPS | | | 5 | NESTED LOOPS OUTER | | |* 6 | HASH JOIN | | | 7 | NESTED LOOPS | | | 8 | NESTED LOOPS | | | 9 | TABLE ACCESS BY INDEX ROWID | SITE | |* 10 | INDEX RANGE SCAN | VONAME_IDX | |* 11 | TABLE ACCESS BY GLOBAL INDEX ROWID| JOB | |* 12 | INDEX RANGE SCAN | JOB_SITEID_IDX | |* 13 | INDEX RANGE SCAN | TASK_ID_TYPEID | |* 14 | TABLE ACCESS FULL | TASK_TYPE | | 15 | TABLE ACCESS BY INDEX ROWID | APP_GENERIC_STATUS_REASON | |* 16 | INDEX UNIQUE SCAN | PK_APP_GENERIC_STATUS_REASON | |* 17 | INDEX UNIQUE SCAN | PK_SHORT_CE_NAME | | 18 | TABLE ACCESS BY INDEX ROWID | SHORT_CE | ----------------------------------------------------------------------------------- • Parent operations get input only from their children (data sources) • Data access starts from the first line without children • Rows are “sent” upwards to parent data sources in cascading fashion
SQL Monitoring • Oracle 11g Real-TimeSQL Monitoring • Allows you to monitor the performance of SQL statements while they are being executed and the breakdown of time and resources used during execution • Monitors statements that consume more than 5 seconds of CPU or IO time (and samples the execution every second) • One can override it by using the MONITOR or NO_MONITOR hints. • Reports can be viewed in Oracle Enterprise Manager or generated directly in a database using package dbms_sqltune.report_sql_monitor • Short demo …
Execution plan – interpreting • Oracle tries to estimate cardinality of each execution phase (row in the plan) • It uses statistics (on tables and indexes) • It applies certain heuristics for complex clauses • It can use dynamic sampling, if no statistics available • if the estimate is orders of magnitude wrong – the execution plan will not be optimal (hours vs. minutes)! • Use /*+ gather_plan_statistics */ hint ------------------------------------------------------------------------------------------ | Id | Operation | Name | Starts | E-Rows | A-Rows | ------------------------------------------------------------------------------------------ | 1 | SORT GROUP BY | | 1 | 1 | 1 | |* 2 | FILTER | | 1 | | 1314K | | 3 | NESTED LOOPS | | 1 | 1 | 1314K | |* 4 | HASH JOIN | | 1 | 1 | 1314K | |* 5 | INDEX RANGE SCAN | T2_IND_3 | 1 | 2841 | 2022 | |* 6 | TABLE ACCESS BY LOCAL INDEX ROWID | TEST | 1 | 3879 | 4771K | |* 7 | INDEX SKIP SCAN | TEST_IND_2 | 1 | 3567 | 4771K | |* 8 | INDEX RANGE SCAN | T6_IND_4 | 1314K | 1 | 1314K | ------------------------------------------------------------------------------------------
Session Manager • Available for many production and DBs at CERN • https://session-manager.web.cern.ch/
Oracle Enterprise Manager • Available for many production and DBs at CERN • https://oem.cern.ch/em
Key Points • Treat performanceas a feature • Tuning the design is most effective • Know your application and usage of Oracle • How will the users access your app? • Follow a development lifecycle process • development -> test-> (stress test) -> production Oracle Tutorials, Troubleshooting Performance
Key Points • Troubleshoot performance by understanding • Clear goal expressed with user-centric metrics • Gather relevant data and build model • Use SQL profiling • Understand where time is spent • Understand where bottlenecks are • Learn to read execution plans • Add profiling to your application • Measure time of critical session accessing DB Oracle Tutorials, Troubleshooting Performance
Central DB Services • CERN IT-DB • Don’t hesitate to ask our help • Open a ticket with us using SNOW • Thank you for your attention! • Q&A Oracle Tutorials, Troubleshooting Performance