Download
1 / 18
180 likes | 296 Views
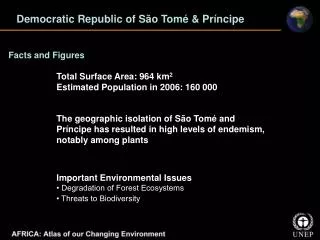
FACTS AND FIGURES. Population : 48.219 (primo 2006) 18 islands, 17 inhabitet More than 100 towns and villages Largest municipality : Tórshavn, 19.317 Smallest municipality : Fugloy, 44 GDP pr. capita in 2003 : 24.400 (USD) GDP pr. capita (Denmark) :29.200 (USD ) The Economy

E N D
FACTS AND FIGURES Population: 48.219 (primo 2006) 18 islands, 17 inhabitet More than 100 towns and villages Largest municipality: Tórshavn, 19.317 Smallest municipality: Fugloy, 44 GDP pr. capita in 2003: 24.400 (USD) GDP pr. capita (Denmark):29.200 (USD) The Economy 2004-2005: Growth of around 3% 2006: Expected growth around 4% 113 km 2 hours Industry and export Fisheries main industry Fish and Fisheris represents 99,6% of the Faroese export in 2003.
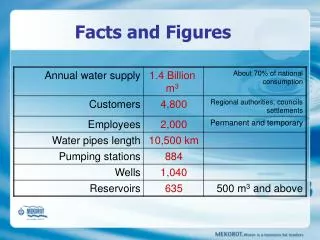
< – -20% • 20% – -10% -10% - 0 0 – 10% 10% – 20% > 20% Changes in populationin the municipalities1985-2003
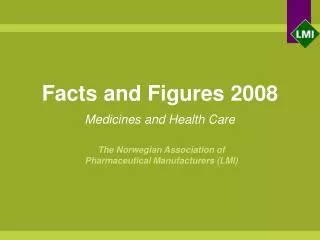
< 135.000 135.000 – 145.000 145.001 – 155.000 155.001 – 165.000 > 165.000 Taxable income per capita inthe municipalities in 2004 In the Faroes Highest: The municipality of Fugloy 192.490 kr. Lowest: The municipality of Mykines 108.202 kr. Chosen municipalities Tórshavn: 170.631 kr. Klaksvík: 153.714 kr. Runavík: 150.214 kr. Tvøroyri: 144.020 kr. Fuglafjørður:154.729 kr. Vágur: 139.110 kr. Sandur: 135.957 kr.
17% 17% – 19% 14% – 16% 13% (average) > 13% Percentage of the populationin the municipalities thatare 65 years or older (ultimo 2002) In the Faroe Islands Highest The municipality of Gjógv: 49,1% are 65 years or older Lowest The municipality of Viðareiði: 8,1 % are 65 years or older Higest in the Nordic countries Luhanka (Fi): 31,1 % Bjurholm (Sw): 29,2% Ibestad (No): 28,4% Tranekær (Dk): 27,0% Broddaneshreppur (Íce.): 26,8%
Population in the different region 1950-2001 Main changes Suðuroy 1950=19,5% of the population, today 10,3% Tórshavn 1950=20,4 % of the population, today 40,1 %
Opdrætsnæringen • ILA – ser ud til at være løst ved vaccinering • Markedsadgang: EU, RUSLAND,USA,JAPAN • Export: 2006 2007 2008 • 12.000 tons 20.000 tons 40.000 tons
FISKERIERHVERVET 2005 • EKSPORT : 2004 2005 3.4 mia 3,3 mia • RESULTAT: 2004 2005 • FABRIKKER - 40 mio -15 mio(ca.) • FANGST(TONS) 104.000 114.000
NØGD tons VIRÐI í 1000 kr. MIÐALPRÍSUR pr. Kg Fiskaslag 2004 2005 2004 2005 2004 2005 Toskur 25.282 18.875 389.519 340.149 16,05 18,90 Hýsa 22.356 19.974 177.161 198.688 8,33 10,59 Upsi 42.581 62.061 139.896 248.389 3,35 4,22 Annað 14.271 13.026 111.051 120.194 16,41 18,00 Íalt 104.490 113.936 817.627 907.420 Feskfiskefangst i mængde, værdi og gennemsnitspris 2004 og 2005
FREMTIDENS KRAV • Føroya Sporførisskipan. • MSC (Marine Stewardship Counsil ) • Sustainable fisheries • God markedsadgang - frihandelsavtaler