Download

1 / 26
260 likes | 423 Views
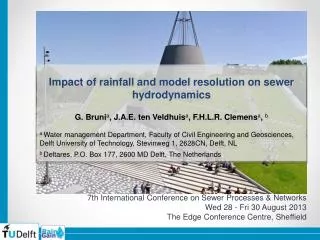
Assessment of sewer flooding model based on ensemble quantitative precipitation forecast. Lee et al. (2013): Assessment of sewer flooding model based on ensemble quantitative precipitation forecast. J. Hydrology , in press. . Speaker: Yi- Jui ,Su Advisor: Professor Ming- Jen,Yang

E N D
Assessment of sewer flooding model based on ensemble quantitativeprecipitation forecast Lee et al. (2013): Assessment of sewer flooding model based on ensemble quantitative precipitation forecast. J. Hydrology, in press. Speaker: Yi-Jui ,Su Advisor: Professor Ming-Jen,Yang Date : 2013/03/05 Keywords: Typhoon Quantitative Precipitation Forecast Ensemble Experiment(TYQPFE) Storm sewer design criteria Inundation evaluation system
Outline • Introduction • Keywords • Typhoon Quantitative Precipitation Forecast Ensemble Experiment • Storm sewer design criteria • Inundation evaluation system • Methodology • Inundation probability • Inundation evaluation model application • Verification method • Results and discussion • Typhoon Megi • Typhoon Nammadol • Conclusions • References
Introduction Introduction • The hydrological forecasting models : short duration (1–3 h) The meteorological forecasting models : long-duration (24 h or more). →The short lead-time is considered insufficient for pre-disaster warning →this has driven the development of meteorological forecasts in recent years. • By Cunge et al. (1980), Chen et al. (2005&2006) developed warning systems that integrated precipitation, watershed runoff, 1-Dflood routing, and 2-Dinundation modeling.
Introduction Introduction • Thielen et al. (2009) and Bartholmeset al. (2009) developed the European Flood Alert System(EFAS) by incorporatingthe weather forecasts from the German Weather Service(DWD) and the European Centre to provide early warning information for floods in Europewith a lead time up to 10 days. • Based on the results of ensemble QPF designed by the Taiwan Typhoon and Flood Research Institute (TTFRI), the main task of this study is to develop a system that can effectively evaluate inundation and provide warning message for townships throughout Taiwan.
Keywords Keywords • Typhoon Quantitative Precipitation Forecast Ensemble Experiment(TYQPFE) • Storm sewer design criteria • Inundation evaluation system
Keywords TYQPFE Typhoon Quantitative Precipitation Forecast Ensemble Experiment • TYQPFE conducted by the TTFRI since 2010. • Goal : developing the QPF to provide inundation information • When Typhoon affect Taiwan, the experiment generated 4 runs a day in 5-km grid size • In 2010, using WRF model with 15 ensemble members In2011, adding MM5 and CReSS to 20 ensemble members
Keywords Design criteria Storm sewer design criteria • 314design rainfall rate data collected from the CPAMI • Property: • Rainfall duration = Time of concentration of sewer drainage system (30 min – 2 h) • Design return period is based on considerations of cost & safety (2 - 5 years) ∴To match the time scale of TYQPFE, used 1-h & 2-h rainfall rate. • Problems for unreasonable design criteria: • For 2-h design rainfall rate ≈ 1.5 * 1-h design rainfall rate • Storm sewer systems are incapable to operate at 100%capacity
Keywords Inundation evaluation Inundation evaluation system • For controlling and understandingthe rainfall movements beforehand →Timely inundation warnings and initiation of preventive measures in potential disaster areas • In flood forecasts, the uncertainty is due to inadequate precipitation input, local topography, setting of model initial conditions →For physically-based 3D models,too intricate →A fast warning system use non physically-based 2D models like statistical or conceptual models
Methodology Methodology • Inundation probability • Criteria of sewer capacity (CSC) • Percentage of ensemble members (PEMs) • Inundation evaluation model application • Verification method
Methodology Inundation probability Inundation probability • Categories of inundation causing : • Dam overflows(∵high river stage) • Inundation (∵dam breaches) • Insufficient drainage(∵strong precipitation) • Sea water encroachment(∵storm surges or tsunamis) • ∵ Urbanization causes shortened time of concentration ∴Using design rainfall intensity of storm sewer to compare with QPF to determine the probability of inundation • Evaluating the inundation probability: CSC & PEMs methods
Methodology Inundation probability Criteria of sewer capacity (CSC) • Original sewer design criterion compare with QPF, as function • The maximal inundation probability from the evaluation results of E is used to evaluate inundation probability at time t (Guo et al., 2011) None Low Medium High probability Design criterion 55% 85% 115%
Methodology Inundation probability Percentage of ensemble members (PEMs) • More members predicted the rainfall rate > design rainfall rate means higher inundation probability • M : numbers of members • TM : the total number of members. No Low Medium High probability ( > ) Members Proportion 0% 25% 50%
Methodology Model application Model application (observed) Collect the criteria for sewer design precipitation intensity Obtain spatial-averageprecipitation intensity usingThiessen method Both 1-h & 2-h precipitation depths Only 1-h precipitation depth
Methodology Model application Model application (TYQPFE) Collect the criteria for sewer design precipitation intensity 1) Spatially interpolated to the locations of rain-gauging stations 2) Obtain spatial-averageprecipitation intensity usingThiessen method Compare the QPF from each ensemble members with the criteria Obtain average maximum 1- h and 2-h precipitation intensities from ensemble members CSC methods PEM methods
Methodology Verification method Verification method • A contingency table determining whether a forecast should be “yes” or “no” • For rainfall : according to set threshold value (50,130,200,350mm) • For inundation: determining “yes” or “no”
Methodology Verification method Verification method Used 4 indices : • Bias score(BS): only describe the relative, cant describe how close • Probability of detection(POD): ignore false alarms • False alarm ratio(FAR):ratio of false alarms, ignore miss • Threat score(TS): as the “critical success index (CSI)”
Results&discussin Results and discussion • Two cases: • Typhoon Megi (2010,10/21 0930 – 10/23 1530) • Typhoon Nammadol (2011, 8/27 1230 – 8/31 0030) • Inundation evaluation : • using observed precipitation • using TYQPFE precipitation
Results&discussin Case1: Typhoon Megi Typhoon Megi Compared period:10/21 -22, 00UTC 1-h precipitation 1-h & 2-h precipitation 1-h & 2-hprecipitation 1-h precipitation
Results&discussin Case1: Typhoon Megi TYQPFE results CSC PEMs
Results&discussin Case1: Typhoon Megi Comparing observed & TYQPFE results CSC PEMs 1-h precipitation 1-h & 2-h precipitation
Results&discussin Case2: Typhoon Nammadol Typhoon Nammadol Compared period:8/28-29, 06UTC 1-h precipitation 1-h & 2-h precipitation 1-h & 2-hprecipitation 1-h precipitation
Results&discussin Case2: Typhoon Nammadol TYQPFE results CSC PEMs
Results&discussin Case2: Typhoon Nammadol Comparing observed & TYQPFE results CSC PEMs 1-h precipitation 1-h & 2-h precipitation
Conclusions Conclusions • Both 1-h and 2-h precipitation depths yields more favorable forecasting on inundation • When using TYQPFE forecast precipitation, CSC method offers more accurate results than PEM method ∵PEM method employs all the members’ results in probabilistic evaluation, which predicts more false alarm for more townships
Conclusions Conclusions • The inundation evaluation system is capable of identifying inundation areaand offers valuable information for early flood warning during Typhoon landfall period in Taiwan • The system has been tested online during typhoon period in 2012 and improved continuously.
References • Lee, C.-S., et al. Assessment of sewer flooding model based on ensemble quantitative precipitation forecast. J. Hydrol.(2012) • Lei, Feng , Yen-Chu Chen,The Development of Quantitative Precipitation Forecast Techniques • 梅姬颱風水災勘查報告 - 成大防災研究中心 • 南瑪都颱風災情蒐集報告 - 成大防災研究中心 • TDB颱風資料庫 • 內政部營建署-下水道建設計畫資訊整合應用網 • 香港渠務署http://www.dsd.gov.hk/TC/Flood_Prevention/index.html • http://ponce.tv/return_period.html • 颱洪中心系集預報實驗介紹-結合系集最佳化定量降雨之先期淹水潛勢評估http://www.ttfri.narl.org.tw/doc/event20130208_II.pdf