Download

1 / 49
490 likes | 617 Views
Evidence for Quality of Surgical Care in Rural America. Samuel R. G. Finlayson, MD, MPH. Overview. General Issues Related to Quality of Surgical Care in Rural Areas Evidence for Quality of Rural Surgical Care review of scant literature

E N D
Evidence for Quality of Surgical Care in Rural America Samuel R. G. Finlayson, MD, MPH
Overview • General Issues Related to Quality of Surgical Care in Rural Areas • Evidence for Quality of Rural Surgical Care • review of scant literature • Preview of new data from Mithoefer/Dartmouth collaboration
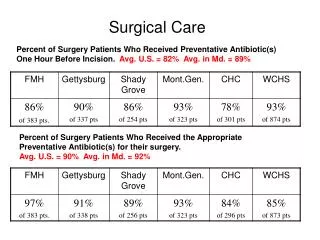
Quality in Rural Surgical Practice • Providing high quality surgical care may not be enough to satisfy all stakeholders • Payers want evidence of high quality • Patients do, too • Challenge is in providing evidence of high quality surgical care
Quality in Rural Surgical Practice: Challenges • Can I just keep track of my outcomes? • Problem of Small Numbers • Practical Realities • payer interests • Potential Solutions • Participation in quality initiatives • NSQIP, Michigan BC/BS, SCOAP • Aggregate measure
Quality in Rural Surgical Practice: Challenges • Can I just keep track of my outcomes? • Problem of Small Numbers • Practical Realities • payer interests • Potential Solutions • Participation in quality initiatives • NSQIP, Michigan BC/BS, SCOAP • Aggregate measure
Low-Volume Providers are Stuck Nearly Impossible to Demonstrate High Quality Results When rates ofadverse outcomes are low,orfew proceduresare performed … … statistical power is often insufficientto show any difference between your own outcome rate and the “benchmark” rate.
The Problem of Power Died Survived 48,500 1500 3% The Nation (benchmark) You 46 4 8% difference in mortality is NOT statistically significant!
The Problem of Power Died Survived 48,500 1500 3% The Nation (benchmark) You 46 0 0% difference in mortality is NOT statistically significant!
The Problem of Power Died Survived 48,500 1500 3% The Nation (benchmark) You 100 0 0% difference in mortality is NOT statistically significant!
Quality in Rural Surgical Practice: Challenges • Can I just keep track of my outcomes? • Problem of Small Numbers • Practical Realities • payer interests • Potential Solutions • Participation in quality initiatives • NSQIP, Michigan BC/BS, SCOAP • Aggregate measure
Practical Realities • Payers may not care about individual results • Bariatric Surgery in Durant, OK. • Proxies for quality are easier for insurers, align with their interests (easy approximations) • Procedure volume • Crude mortality rates • Special certifications
Quality in Rural Surgical Practice: Challenges • Can I just keep track of my outcomes? • Problem of Small Numbers • Practical Realities • payer interests • Potential Solutions • Participation in quality initiatives • NSQIP, Michigan BC/BS, SCOAP • Documents attention to quality • Aggregate outcome measures
Aggregation to Achieve Sample Size • Individual case volumes may be too small to demonstrate one’s results are in line with quality benchmarks • Evaluation of surgical results in the aggregate may help • Irate letter from Iowa
Aggregating Data Tells a Story Died Survived 233 Highest volume surgeon 7 3% Rest of Iowa 1331 4 0.3% HV surgeon’s mortality is higher (p<0.001)
Evidence for Quality in Rural Surgical Practice “Are you just pissing and moaning, or can you verify what you’re saying with data?”
Mithoefer/Dartmouth • Recall prior study of surgeon workforce based on Hospital Service Area (showed results at last symposium) • HSAs categorized along the urban-rural spectrum using RUCA designations • Calculated surgeons per capita (age/sex-adjusted) in each HSA • Compared surgeon workforce levels • across specialties • across the urban-rural spectrum
12 General Surgeons per 100,000 population 10 8 6.94 6.54 6.30 5.52 6 4 2 0 Urban Large Rural Small Rural Isolated
Brief Review of Methods • Rural definitions • Hospital Service Areas
Defining Rural • Rural-Urban Commuting Areas (RUCA) • Developed by US Dept of Agriculture, the Health Resources and Service Administration (HRSA), and the Univ. of Washington • Classify U.S. census tracts using measures of • population density and urbanization • size and direction of daily commuting flow • UW developed ZIP code approximation of the RUCA codes based on an overlay of ZIP code areas on census tracts http://www.ers.usda.gov/briefing/Rurality/RuralUrbanCommutingAreas
Hospital Service Areas (HSA) • Developed using national Medicare inpatient claims • Defined as geographic area that includes one or more hospitals to which local residents generally have the plurality of their inpatient admissions • Based on zip code tabulation areas (ZCTA) • ZCTA is an approximate area representation of the US Postal Service's ZIP code service areas created by the US Census Bureau
A A A A A A A A A A A A A A A A A A A A A A A A A A A A A A A A A A A A A A A A A A A A A A A A A A A A A A
B B B B B B B B B B B B B B B B B B B B B B B B B B B B B B B B B B B B B B B B B B B B
C C C C C C C C C C C C C C C C C C C C C C C C C C C C C C C
B A A B A B B A A A B B A A A A B B B A B B B B A A A B C A A B C C 8 A’s 6 B’s 0 C’s A A A A B A C A B B B B B C B A B B C A B A A A A B B A A A B B A C A B C B B A B A A C A A A A A B B A B A C C A 6 A’s 8 B’s 2 C’s A A A C C C B B A C A C B C C C A B A B A C C C C C A B C A C B B C C C C C
A B C
Hospital Service Areas (HSA) • US parsed into 3067 HSAs • Reflect “health care markets” • Where people actually go for care (not necessarily closest hospital)
Defining Rural vs. Urban HSAs • Categorized hospital service areas into one of 4 RUCA categories • Urban • Large rural • Small rural • Isolated rural • RUCA categorization of a given HSA determined by the plurality of that HSA’s population
A B C Small Rural Small Rural Large Rural Large Rural Large Rural Large Rural Large Rural
Preview of New Data from Mithoefer/Dartmouth • Effort to study outcomes • By rurality of the HSA (patient origin) • By level of surgeon supply (surg-per-capita) • Appendectomy • A good model for studying access to surgical care • timeline, clinical decision making • proposed as potential quality indicator • rural patients have slightly higher rates of perforated appendectomy (adj. OR 1.11, 95%CI 1.02-1.22)* *NIS study, to be presented at ACS Surgical Forum 2009
Mithoefer/Dartmouth • Appendicitis Outcomes Study • National 100% sample of Medicare discharges (age over 65, 3 years of data, >92,000 cases) • Stratified outcomes by urban-rural designation • Specific Outcomes Studied • perforation rates • abdominal abscess rates • negative appendectomy rates
Diagnosis of Perforation with Appendectomy Urban/Suburban Large Town Small Town Isolated Rural *Adjusted for age, sex, race
Diagnosis of Abscess with Appendectomy Urban/Suburban Large Town Small Town Isolated Rural *Adjusted for age, sex, race
Negative Appendectomy Rate Urban/Suburban Large Town Small Town Isolated Rural
Surgeon Supply and Appendicitis Outcomes • From prior work, we know surgeons per capita for each HSA (population age sex adjusted) • Outcomes stratified by RUCA and surgeon supply • No surgeons • ½ the national average surg-to-pop ratio • ½ to 2x national average surg-to-pop ratio • >2x national average surg-to-pop ratio
Perforation Rates and Surgeon Supply 37 36 35 34 33 32 31 30 29 none <1/2 national 1/2 to 2x >2x national average national ave average overall urban/suburban small rural