Download
1 / 18
200 likes | 484 Views
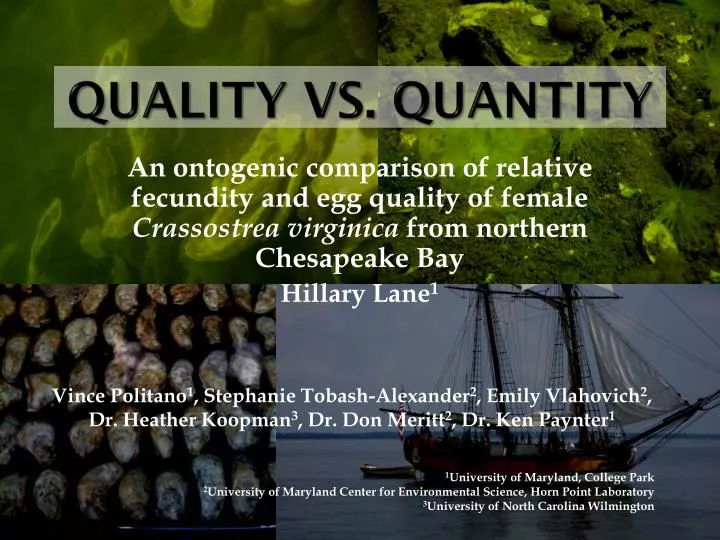
QUALITY VS. QUANTITY. An ontogenic comparison of relative fecundity and egg quality of female Crassostrea virginica from northern Chesapeake Bay Hillary Lane 1. Vince Politano 1 , Stephanie Tobash-Alexander 2 , Emily Vlahovich 2 ,

E N D
QUALITY VS. QUANTITY An ontogenic comparison of relative fecundity and egg quality of female Crassostreavirginica from northern Chesapeake Bay Hillary Lane1 Vince Politano1, Stephanie Tobash-Alexander2, Emily Vlahovich2, Dr. Heather Koopman3, Dr. Don Meritt2, Dr. Ken Paynter1 1University of Maryland, College Park 2University of Maryland Center for Environmental Science, Horn Point Laboratory 3University of North Carolina Wilmington
Chesapeake Bay Commercial Oyster Harvest Bushels “Seasonal year” data (include data from the winter harvest and the preceding year's fall harvest). Data and Methods: www.chesapeakebay.net/status_oysterharvest.aspx Oysters in the Chesapeake Bay
Oyster Restoration in Maryland Oyster Recovery Partnership (ORP) has been seeding natural and restored oyster bars with spat since 1997 Restored Maryland oysters are of known age Negligible natural recruitment + =
C. virginicaReproduction • Synchronous broadcast spawning • Fecundity measured as: • Quantity of eggs ( with oyster size/age) • Fertilization success ( with oyster size/age) • What about egg quality? Let’s find out!
RESEARCH QUESTIONS • What is the relationship between oyster egg quantity and quality? • How do these metrics vary with oyster age? • Can these data help to determine an ideal age for hatchery broodstock and improve population sustainability?
Methods: Sample Collection Magothy River: 4y & 11y • 200 oysters were collected per site • Oysters were conditioned in flow-thru tanks at the Horn Point Oyster Hatchery for 2 weeks Choptank River: 3y & 9y
Methods: Spawning • 100 animals per site were placed on spawning tables with ambient seawater (~20°C) • Water temperature was increased at 5°C intervals for 1 hour • Sperm was removed from males at each site and added to each spawning table once the water temperature reached 30°C
Methods: Egg Collection • Spawning female oysters were immediately removed from the spawning table and placed in a 0.5L plastic tub to collect eggs • Spent females were removed from tubs to collect metrics (shell height , mass, dry weight, P. marinusprevalence) • Eggs were diluted to 30-30 and counted by hatchery staff • Eggs were filtered through 20µm sieves and frozen until lipid analysis
Methods: Lipid Extraction and Analysis • Total lipids were extracted using a modified Folch et al. (1957) chloroform:methanol technique • Lipid content was determined as percent of wet tissue weight • Lipid composition was determined using gas chromatography • Fatty acids were quantified as percent composition
Results: Egg Count No difference in egg count by oyster age, site or size
Results: Egg Lipid Content Dobbins oysters have more total lipid than other sites
Results: Egg Count + Lipid Content Lipid content is driven by # of eggs produced, not oyster age BUT…
Results: Egg Count + Lipid Content by Age When separated by age, egg lipid content is only variable in OLD oysters
Results: Egg Fatty Acid Composition Egg fatty acid composition differs by age and site
Conclusions • Egg lipid content was associated with the number of eggs produced • Oyster age may have affected the variation observed in egg lipid content • Egg fatty acid composition varied by oyster age and site • The differences found in egg quality may indicate differential allocation of resources by oyster age or location
The Perfect Broodstock Animal? • Our data point to differences in egg lipid content and composition in oysters…so what?!?! • Some measure of fertilization success or larval survival should be implemented to determine the ideal age/size oyster for broodstock • These data may also help to identify target oyster sizes or ages for further successful management STAY TUNED!!!
Acknowledgements • University of Maryland College Park • Horn Point Oyster Hatchery + Staff • Oyster Recovery Partnership • NOAA Chesapeake Bay Office • Maryland DNR • Steve Allen • Karen Kesler • Sara Lombardi • Rebecca Kulp • Grace Chon • Drew Needham