Download
1 / 18
190 likes | 605 Views
Sapphire for KAGRA. 2012/7/7 東京大学大学院工学系研究科 附属光量子科学研究センター 三尾典克. Core optics of KAGRA. KAGRA は、鏡を冷却するため、サファイアを鏡の基材として用いる. ETMY. f 10cm. Mirrors for Main cavities Initial: Silica Final: Sapphire. Laser. MC1. MC3. ITMY. MT1. PRM. PR2. ITMX. ETMX. MT2. BS. PR3. SR2. MC2. f 37cm.

E N D
Sapphire for KAGRA 2012/7/7 東京大学大学院工学系研究科附属光量子科学研究センター三尾典克
Core optics of KAGRA KAGRAは、鏡を冷却するため、サファイアを鏡の基材として用いる ETMY f10cm Mirrors for Main cavities Initial: Silica Final: Sapphire Laser MC1 MC3 ITMY MT1 PRM PR2 ITMX ETMX MT2 BS PR3 SR2 MC2 f37cm SRM SR3 大型で良質の単結晶サファイアが必要
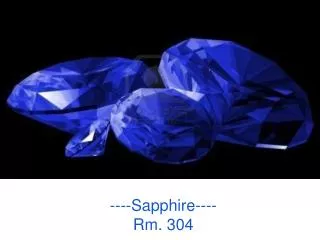
低温鏡の開発 サファイア 酸化アルミニウム(Al2O3) 結晶の光学特性(複屈折)の 揺らぎ 直径25㎝、厚さ10㎝、質量20kgの単結晶 ただしa軸結晶 極限的な材料開発が必要 温度を下げると物質の性質が変わる。 常温(300K)で使用される鏡の材料(合成石英)が利用できない。 光学的に透明な単結晶が望ましい。
Requirements for Sapphire Sapphire • C-axis mirrors (f25cm x t15cm) が必要. • 現状で直径22cm、厚さ15cmが最大 • 吸収係数: < 20 ppm/cm • 現状では 50-100 ppm/cm? • 常温干渉計では合成石英を用いるが、吸収係数は1ppm/cm以下になっている 結晶の評価を行うため、吸収係数の測定装置を立ち上げた
微小吸収係数の測定 • 微小光学吸収 • 吸収した光による温度変化を測定 • 温度計を用いる • 温度変化による屈折率変化を測定 • 光路長変化=> 干渉計 • レーザービームの偏向=> 光熱偏向法 • 熱収縮による変化 • 音波の発生=> 光音響測定法 採用した装置を開発
光熱偏向法 C-axis f: 100 mm x t: 60 mm (2005) Z=50mm, 53.4 ppm/cm Z=40mm, 45.5 ppm/cm Z=30mm, 47.3 ppm/cm Z=30mm Z=20mm, 46.1 ppm/cm absorption measured at this point where the 2 beams meet Z=10mm, 54,2 ppm/cm
Absorbed light power Sample temperature change Refraction Index, length chagne Optical path length change 干渉計@東大 Chopped light is incident on a sample. 120Hz Signal is lock-in detected. Lock-in Amplifier Laser l:1064nm Power:10W Chopper Sample BS(R=98%) BPF LPF PD Drak fringe 15kHz Mirror PZT PZT driver Filter
干渉計の概略 Sample BS Laser light
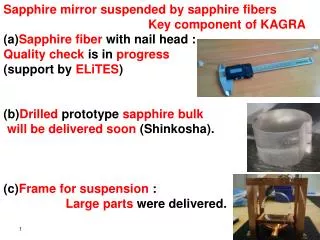
Sapphire sample • C-axis rod (diameter: 10mm, length: 40mm)
Results of Sapphire Measurement in last year Measurement in this year 80ppm/cm 87ppm/cm 同じサンプルで測定結果は再現されている。 校正の問題が残っているので絶対値の不確かさの評価が不十分
Sapphire I LMAで、同時に作成したサンプルの測定を行った=>ほぼ一致している
Sapphire: Preliminary results 10 Samples fromCSI have been measured Name Absorption [ppm/cm] preliminary • AA149 と P401は小さな吸収係数を実現した。 • AC150 はとても大きな値を示した? • P401 場所により2倍違う? • この結果は製造者であるCSに連絡した。
問題点 • 現状製造者がCSIに限られている。大きさの制限がある。吸収係数の値も不十分。 • 今後 • 大きな C-axis 鏡の実現 (d:25cm x t:15cm) :中国との連携。 • 品質の改善:吸収の原因が不明。 • 大型結晶による鏡面研磨の性能評価:Zygoがテスト研磨を行っている。 • 物性的な側面から掘り下げる必要があるかもしれない。
ご指導・ご協力をお願いいたします。 ありがとうございました。
Modeling of the signal Intensity distribution of incident light Heat Equation Temperature change in the sample Beam width>>Thermal diffusion length Quadrature phase Change of Index of refraction Thermal expansion Numerical simulation date are compared to the experimental ones. Change of optical path length 15 15
Test Sample: BK7 BK7: Standard glass for optics that has rather large optical absorption (10-3-10-4 /cm) Calculated Temperature Distribution Radial Length:40mm, Diameter: 20mm Temperature changeMax: 0.01℃ 0.6mm 0.6mm End surface: AR coating 16 16 Axis Laser beam: diameter: 0.1 ㎜
Results of BK7 40mm 10mm No sample • Two results with different lengths are consistent. • Results • No sample: -2 pm/W • BK7(10mm): 80 pm/W • BK7(40mm): 284 pm/W • Optical absorption 10mm: 2230 ppm/cm 40mm: 2300 ppm/cm
Calibration Comparison with another method • A thermistor is attached on a lateral surface of the BK7 sample in order to measure the temperature change of the sample. • The difference between the gradient of the temperature change is almost independent of the boundary condition. Off On Off On The experimental data and the numerical simulation are consistent. What causes this discrepancy? Optical Absorption: 1600 ppm/cm