Download
1 / 24
240 likes | 351 Views
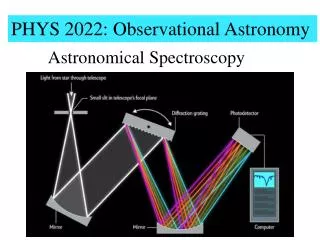
Astronomical spectroscopy and the Virtual Observatory: a user-oriented perspective. Matteo Guainazzi 1 , Andrea Laruelo, Jesus Salgado, Isa Barbarisi, Pedro Osuna ESA-VO, Science Operations Department European Space Astronomy Center of ESA Villafranca del Castillo, Spain

E N D
Astronomical spectroscopy and the Virtual Observatory: a user-oriented perspective Matteo Guainazzi1, Andrea Laruelo, Jesus Salgado, Isa Barbarisi, Pedro Osuna ESA-VO, Science Operations Department European Space Astronomy Center of ESA Villafranca del Castillo, Spain 1also EURO-VO astronomer
Outline • Why do we care? • Spectroscopic surveys in the past and in the future • Which added value can VO bring to the analysis of spectroscopic data? • What does the VO currently offer? • Data models • Data access protocols • Spectral services • Spectral VO applications • Adds-on • Access to atomic and molecular lines databases • Access to theoretical models
Spectroscopic surveys: the past (Yip et al. 2007) Number of redshifts in surveys as a function of time
Evolution of survey source numbers (Cropper 2007)
What do we gain with the VO? We should be able to largely gain in efficiency (from “it would take my whole lifetime to do it” to “it can be done by my Ph.D. student”) for tasks like: • Building spectral energy distributions (spectra+photometry) by combining large datasets from different sources • Comparing spectra and images (footprint, contamination …) • Analysis and clever visualization of large datasets • Correlation of spectrally-derived parameters from different sources • Automatic classification (and outliers discovery) • Multi-parameter connectedness (M.Cropper) • Selection of sub-samples on the basis of a multi-parameter space • Access to ancillary information useful for the interpretation of the data: existing object classification, publications
What should VO tools be also able to do? • Basic display tools: superposition, rebinning, smoothing, dynamical spectra • Radial velocity measurements and superposition of spectral region in the velocity parameter space • Rectification • Fits (Gaussian, Maxwellian, Voigt profiles) • Measurement of line profile asymmetry and broadening • Time analysis (periodograms, Fourier analysis, Doppler imaging) • Spectral deconvolution in energy and Fourier space • Comparison between observed spectra and spectral templates • Comparison between observed spectra and theoretical models • Not all functionalities must be simultaneously present in a given tool!
What does the VO offer? • Data models and data access protocols: • Simple Spectral Access (SSA; Tody et al. 2007) • Based on the concept of a “1-D” spectrum: spectral coordinates, flux, error, quality flag, etc, • Virtual data generation: cut-out, reprojection, dynamic extraction etc. • Support to multiple data format: VOTable, FITS binary, CSV, native XML, HTML • Spectrum Data Model (Mc Dowell et al. 2007) • Spectral services • Applications • Specview (STScI) • SPLAT (AstroGrid) • VOSpec (ESA-VO)
What does the VO offer? • Data models and data access protocols: • Simple Spectral Access (SSA; Tody et al. 2007) • Based on the concept of a “1-D” spectrum: spectral coordinates, flux, error, quality flag, etc, • Virtual data generation: cut-out, reprojection, dynamic extraction etc. • Support to multiple data format: VOTable, FITS binary, CSV, native XML, HTML • Spectrum Data Model (Mc Dowell et al. 2007) • Spectral services • Applications • Specview (STScI) • SPLAT (AstroGrid) • VOSpec (ESA-VO)
EURO-VO spectroscopic tools VOSpec SPLAT-VO http://star-www.dur.ac.uk/~pdraper/splat/splat-vo/splat-vo.html http://esavo.esa.int/vospecapp
Basic working scheme Collect spectra Build SED Prepare spectra Analyse spectra Publish results • Local files • Remote servers • Units? • Data screening • Rebinning • Filtering • De-noising • De-reddening • Units conversion • Spectra arithmentic • Convolutions • Paper-quality plots • Export analysis • EW • Flux • Fit • Bisectoring • Mirroring • Interpolation • Line identification • Theory
SED generation and graphics • Access to spectra from: • Local files (FITS, ASCII, NDF …) • Files available on the Internet • Simple Spectral Access Protocol compatible servers: • (CDF-S, EUVE, FUSE, Giraffe, HST, HUT, Integral/OMC, ISO, IUE, SDSS, XMM-Newton/RGS, WHS, WUPE …) • Units handling • Most of the standard units on the frequency/energy/wavelength axis, and on the flux density axis can be hadled automatically • VOSpec also handles automatically any units via dimensional analysis • Plotting • Single- and multi-spectra plotting, with various standard graphical facilities • SPLAT allows the co-existence of different plotting windows, a “drag the file name” function to display a new spectrum, and movie generation • VOSpec allows interactive mouse-driven zooming
Analysis tools: SPLAT • Conversion to velocity, redshift or Lorentz factor space • Spectral arithmetic for spectra (limited to strictly overlapping frequency ranges) • Pairs of spectra • Spectra and a constant • Cut and removal of spectral ranges • Fit of continua and emission/absorption lines • Generation of a spectrum from an interpolated line (needed to evaluate the continuum level underneath a fitted line) • Filtering • Flipping/translating • SPEFO (legacy software from Ondřeov Observatory)
VOSpec: spectral analysis functionalities I. • Arithmetic and convolution between spectra • Line fitting • Best Fit of theoretical models Fit of an absorption line profile with different models (Gaussian, Loretntzian Voigt) Fit of theoretical models to an observed spectrum (see later)
VOSpec: spectral analysis functionalities II. • Mirroring, bisector • Interactive integrated flux and equivalent width • Filtering • Discrete wavelet analysis • Wavelength-to-velocity conversion • Dereddening: • Calzetti law • Cardelli-O’Donnel law • LMC law • Calculation of luminosity differences between observational spectra and models
The power of interoperability I. Aladin: multipanel imaging AstroScope: catalogue search GB 2MASS SDSS ROSAT Chandra VOSpec: generation of SEDs TOPCAT: tabular data plotting/manipulation
Community efforts I.: EZ and GOSSIP GOSSIP: Spectrophotometric analysis through SED fitting (not VO yet) EZ: Automatic calculation of spectroscopic redshifts (Franzetti 2007; Garilli 2007) http://cosmos.iasf-milano.inaf.it/pandora
Simple Line Access through VOSpec • VOSpec provides access to atomic and molecular line Databases throuh a specific VO access protocol (SLAP): • NIST • CHIANTI (X-rays) • CIELO (XMM-Newton) • IASD (ISO) • LERMA (molecular) • This allows on-the-fly identification of transitions associated to a given observed feature • SPLAT includes a hardcoded line identification facility on the basis of standard sets of lines
Easy access to theoretical models (TSAP) SVO web server implementation (http://svo.laeff.inta.es) ESA-VO VOSpec implementation
Select initial parameters Select TSA server Initial model minimization proccess Best fit model Thoretical models fit step by step • Selecting TSA server
Little, little, twinkling star … Will we ever have X-ray data in the VO? • Traditional wisdom: no! • Spectra in X-ray archives are in instrumental counts • Conversion into physical units is strongly model dependent due to non-linearity of the redistribution matrix • “We” X-ray astronomers know how to do it: ask us! XMM-Newton EPIC redistribution function ?
Yes! XMM-Newton/RGS (Gonzalez-Riestra & Rodriguez-Pascal 2007) • However, high-resolution instruments are now flying: XMM-Newton RGS (R≈300-1800) • The redistribution function is very close to linear • Model independent fluxed spectra can be produced • Soon availabe as VO server (the first all-sky spectral X-ray server ever) • Pilot project on Seyfert 2 galaxies available since 1 year (CIELO-AGN) • No general solution yet for moderate-resolution spectra (XMM-Newton/EPIC, Chandra/ACIS, Suzaku/XIS, Swift …) RGS redistribution function ABDor
Conclusions: wher do we stand? • On-the-fly SED generation: • Spectra access from SSAP-compatible server • Automatic handling of units • Spectral analysis tools • Growing suite of spectral analysis tools available in the “mainstream” tools • Multi-component fit possible • Community-based web-services start appearing for more specialized tasks • Interoperability • All tools use PLASTIC • First steps to export via PLASTIC also the analysis results • Usage on massive sets of data • Mainly designed to handle one source at the time → highly interactive
(Le Fèvre et al. 2006) (Brandt et al. 2001) (Belokurov et al. 2006) Science highlight from spectroscopic surveys VVDS Discovery of high-redshift dusty galaxy population with strong star formation XMM-Newton SDSS High-redshift QSOs SDSS, z~0.1 (Cooper et al. 2006) SDSS: New stellar streams and satellites of the Milky Way DEEP2, 0.75<z<1.05 SDSS+DEEP2 Red galaxy environment