Download

1 / 12
140 likes | 306 Views
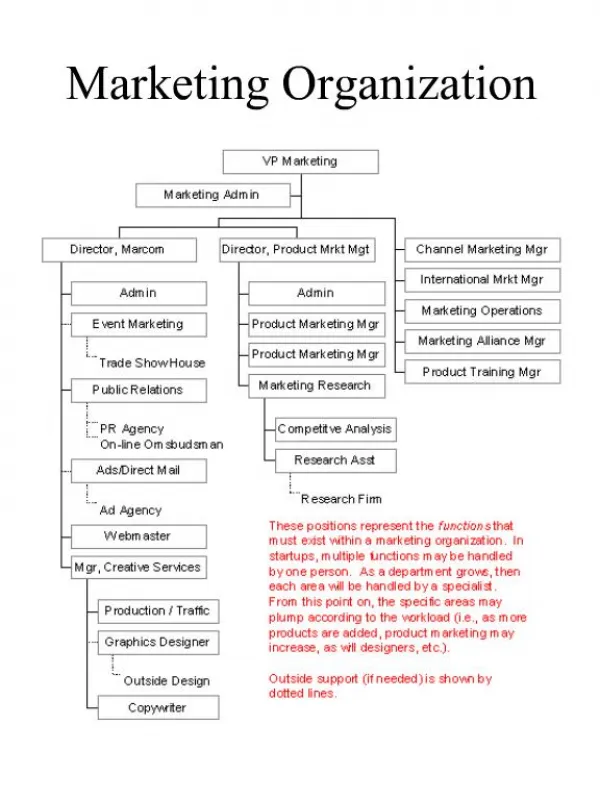
Deloitte Analytics Enabling a more effective, proactive marketing organization. May 2014. Marketers today are looking to improve performance and reduce churn through an enhanced customer experience. The competitive advantage: Real-time actions, tailored to each customer.

E N D
Deloitte Analytics Enabling a more effective, proactive marketing organization May 2014
Marketers today are looking to improve performance and reduce churn through an enhanced customer experience The competitive advantage:Real-time actions, tailored to each customer Real-time offers to encourage conversion Customizedmessaging to connect with customers High value customer segments Unique interactions to build loyalty Exhibiting attrition behavior Customer interaction preferences Automatic action allows you to proactively own the customer relationship
At Client X, member retention was a strategic priority and a predictive model helped to close the gaps between member renewal targets and attainment Background • Increasing membership retention is a strategic priority; Revenue from membership represents approximately 53 percent of Client X’s net income • In recent years, the membership base has stagnated and renewal rates for new members are low • There is a gap between the forecasted member revenue plan and actual member revenue growth • Understanding membership renewal patterns and reasons will help close the gap Key Business Objectives • Short Term: Identify gaps by membership type that can be filled to bring membership income to plan • Long Term: Inform development of a membership renewal strategy • Additionally, provide valuable information to the Winback team to optimize budgets Project Objectives • Identify members most likely to attrite • Understand attrition drivers by member • Of these members, identify most likely responders to intervention strategies
Insights and tools generated by the project enabled Client X to improve membership retention • Tools to enable • Base data exploration • Univariateanalysis • Churn predictions exploration • Interventions targeting • Insights by member • Renewal scores • Renewal Reason codes • Intervention lists • Frameworks to enable actions from insights • Periodically score members • Periodically recalibrate • Test plan Deliverables Outcome (Response) Drivers (explanatory Variables) • Member Characteristics • Age • Gender • Income • Tenure • Distance To Club • Cohort • Education Level • Investor Likelihood • Dwelling Type • Family Type • Occupation • Yrs. at Residence • Donates Money • Acq. Month • Card Type • Upgrade Ind • Downgrade Ind • Renewal Type • Member Behavior • Promo Participation • Promo Response • Number of renewals • Pct. on-time renewals • Pct. late renewals • Member Interactions • Purchase Amt 6/12 mos • Upgrade in 6/12/24 mos • RFM Decile • RF Decile (50/50) • WRFM Decile (39/60/1) • R / F / M Decile • # Unique cat Shopped in last 6/12/24 mos • Cat Shopped in last 6/12/24 mos • Activity by Channel • Store Characteristics • Location Type • Store Size, Tenure • Number of Employees • SIC Segment, Micro / Metro • Comp in 10 miles • Restaurant in 10 miles • FIC – FY 11/12 Renewal • Micro / Metro • Portfolio–2010/11 Renewal • Proto Size • Remodeled in 2010/11 • Client X Combo • Member renewal indicator (Prediction target variable) • Member renewal likelihood score • Member renewal reason Codes • Intervention Responsive-ness scores Business Questions
Definitions and assumptions within the modeling approach Definition of Attrition • For the purposes of the models, attrition was defined as a failure to renew by 60 days following a member’s DTR date Normalization of Member Year • Member behavior was examined by quarter and normalized for each member’s unique member year • Q1 for each member refers to the 1st through 3rd months of their membership (not Q1 of the calendar year) Model Scope • Five models were built: • 1 model that predicts attrition for the entire member population • 4 sub-models differentiated by member type (Advantage vs. Business) and tenure (first-year members vs. tenured members) used to explain reasons for attrition risk “Category Groups” • For the purposes of examining category purchase behavior, five “category groups” were looked at: • Consumables excluding Snacks/Candy • Snacks/Candy/Tobacco • General Merchandise • Gas/Car Wash • Miscellaneous/Other
The suite of deliverables allowed Client X to both act upon the insights generated from the analysis, and re-run the models in the future 2 3 1 Model Outputs Use Cases Attrition Models Member Scores and Reason Codes Model Code Model Usage Examples WMS Tableau Visuals of Scores and Reason Codes Model Formulas
The attrition model was used 6 months before a member’s DTR date – enabling Client X to identify potential attriters and intervene early • The model predicts well in the highest risk groups (deciles 8, 9 and 10) when run at the DTR date • When run at 6 months from DTR, the model retains a large portion of its predictive power Run for members at DTR date Run for members 6 mo. prior to DTR Decile Gains: 1.55 2.24 3.13 Decile Gains: 1.55 2.13 2.65 Membership (Thousands) 2012 attrition rate = 26% Predicted to renew Predicted to attrite Predicted to renew Predicted to attrite Attrited Renewed
The model also explained why high risk members are at risk. Client X used this insight to develop intervention options This graph depicts how often each factor appeared within the top 5 most significant predictors for each member in the three ‘at risk’ deciles (i.e. top 30% most likely to attrite) • Among the most at-risk members, lack of shopping (from a $ perspective) or a decrease in shopping across quarters are the most common signals of attrition • Lack of purchases in General Merchandise also is a common factor behind the at-risk population • The next-most-common signal is a tendency to buy very few items, but relatively high-margin ones (i.e., spend high $ on a big-ticket item, then attrite) 1 All Member Population 2 1 2 3 3 • What interventions can Client X take 6 months prior to the member’s DTR date to: • Re-engage shopping frequency and spend? • Drive purchases / spend in the General Merchandise category-group? • Introduce ‘one and done’ members to the rest of the club experience?
Case Study 2 – Customer Churn Management Large Gaming Company Discussion Topics • Potential insights to be gained from analytics: • How do you formulate consumer segments based on customer value? • How do consumers’ purchase paths relate offline and online, and how can marketing influence them at appropriate stages with right messages? • What type of engagement is most relevant for consumers at certain deflection points (e.g., price, offer, brand promotion)? • Potential operational considerations: • How do companies need to restructure the way customer data points are captured in order to be able to perform customer lifetime value and cost-to-serve analytics? Customer Lifetime Value Example
Case Study 2 (cont.) – Reduce Customer Churn with Lifetime Value Analysis Churn Rate Analysis Example ILLUSTRATIVE % of Customers Remaining % of Customers Remaining Starting with a 1 month Online sub Starting with a 1 month non-online sub * Starting with a 1 year Online sub Starting with a 1 year non-online sub Months after Initial Subscription Purchase Insights • Churn is higher for customers who purchase via retail • Non-online buyers can be moved online by driving awareness of the benefits of the online options • Moving non-online customers to online subscription increases Customer Lifetime Value by $100 on average