Download
1 / 12
130 likes | 282 Views
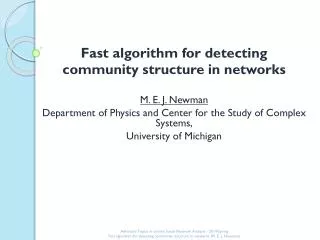
The Structure of Scientific Collaboration Networks by M. E. J. Newman. CMSC 601 Paper Summary Marie desJardins January 27, 2009. Outline. Overview Social networks Scientific collaboration networks Properties Data sets Results Conclusions. Overview.

E N D
The Structure of Scientific Collaboration Networksby M. E. J. Newman CMSC 601 Paper Summary Marie desJardins January 27, 2009
Outline • Overview • Social networks • Scientific collaboration networks • Properties • Data sets • Results • Conclusions
Overview • Computationally analyze scientific collaboration networks • Uses actual data sets from online archives • Findings: • small-world property • presence of “clustering” • power law distribution of #collaborators, #papers • different patterns in different fields
Social Networks • Idea: Represent acquaintanceship relationships between individuals • Measure graph-theoretic properties • Widely studied in social science Penny David Marie Sergei Lise Peter
Penny David Marie Sergei Lise Peter Properties of Social Networks • Degree (# edges) • z(Marie) = 4 • z = 3 • Degree distribution = [2, 2, 3, 3, 4, 4] • Clustering • C = probability (ij | ik, jk) = 12/20 = .6 • Degree of separation (path length) • average = 1.47 • random graph log N / log z (typically 6)
Scientific Collaboration Networks • Represent co-authorship relationships • Data sets: • Biomedical research (MEDLINE) • Theoretical physics (Los Alamos e-Print Archive (arxiv)) • High-energy physics (SPIRES) • Computer science (NCSTRL) • Papers from 1995-1999 • 13K – 2M papers
Erdös Number • Paul Erdös • Famous Hungarian mathematician • Published over 1400 papers! • Erdös Number = co-authorship distance to Erdös • Marie’s Erdös Number = ??
Counting Authors • Ambiguity in names (first name vs. first initial vs. all initials) • Two counts: all initials vs. 1st initial • Upper/lower bounds on number of authors
General Properties • Average number of papers per author: 4 • Average number of authors per paper: 3 • Max: 1681!! (SPIRES) • Average number of collaborators: • Ranges from 4 (high-energy theory) to 173 (SPIRES) • Size of largest connected component: • Ranges from 60% (CS) to 90% (astrophysics) • Amount of clustering: • Ranges from 7% (MEDLINE) to 73% (SPIRES)
Degree Distribution • Earlier work showed power law distribution of degree (would be straight line) • Here we see a power law distribution with an exponential cutoff • Conjecture: result of limited time window, and limited publication life of scientists
Degrees of Separation • Average degree of separation 6 • “Small world” property – comparable to distance in random graph • Diameter (max distance) typically around 20 • (for largest connected component)
Summary • Scientific collaboration networks • Social networks exhibiting interesting structure • Lots of available data • Key characteristics • High clustering • Small-world property • Power-law distribution of #authors, #papers • Properties vary across fields