Download
1 / 36
360 likes | 461 Views
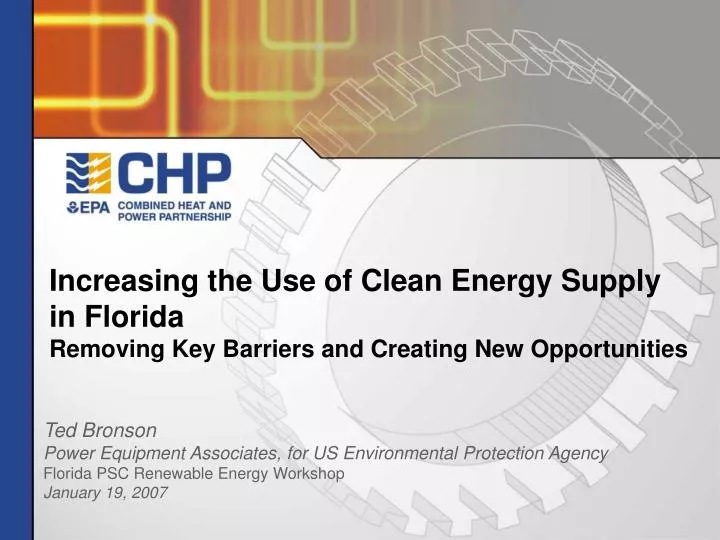
Increasing the Use of Clean Energy Supply in Florida Removing Key Barriers and Creating New Opportunities. Ted Bronson Power Equipment Associates, for US Environmental Protection Agency Florida PSC Renewable Energy Workshop January 19, 2007. Overview of Presentation. Introduction.

E N D
Increasing the Use of Clean Energy Supplyin FloridaRemoving Key Barriers and Creating New Opportunities Ted Bronson Power Equipment Associates, for US Environmental Protection Agency Florida PSC Renewable Energy Workshop January 19, 2007
Overview of Presentation Introduction Standardized Interconnection Rules Utility Rates Renewable Portfolio Standards Contact Information
What is Clean Energy? • Clean energy includes demand- and supply-side resources that deliver clean, reliable, and low-cost ways to meet energy demand and reduce peak electricity system loads. Clean energy resources include: • Energy Efficiency reduces demand for energy and peak electricity system loads. Common energy efficiency measures include hundreds of technologies and processes for practically all end uses across all sectors of the economy. • Renewable Energy is partially or entirely generated from non-fossil energy sources. Renewable energy definitions vary by state, but usually include solar, wind, geothermal, biomass, biogas, and low-impact hydroelectric power. • Combined Heat & Power, also known as cogeneration, is a clean, efficient approach to generating electric and thermal energy from a single fuel source. Inherently an energy efficiency measure.
Clean energy can reduce electricity demand and meet load growth to help address many state energy challenges Clean Energy Benefits
State Approaches to EncourageClean Energy Five state approaches with significant potential to increase clean energy supply.
Introduction Standardized Interconnection Rules Utility Standby Rates Renewable Portfolio Standards Contact Information
Standard Interconnection Encourages Clean Energy • Policy Objective: Establish clear and uniform application processes and technical requirements for connecting distributed generation (DG) systems to the electrical grid. • Policy Advantages: These rules are an important mechanism for improving the market condition for clean DG by: • Ensuring that the costs of interconnection are the same throughout the state and are commensurate with the nature, size, and scope of the DG project. • Helping DG project developers accurately predict the time and costs involved in the application process and the technical requirements for interconnection. • Ensuring that the project interconnection meets the safety and reliability needs of both the energy end-user and the utility.
As of December 2006, 18 states have adopted standard interconnection rules; 14 more are in the process. States With Standard Interconnection Rules States with Standard Interconnection Rules Source: EPA Standardized Interconnection Rules An Effective Policy to Encourage Distributed Generation. http://www.epa.gov/chp/pdf/interconnection_fs_123006.pdf
Key Features of Standard Interconnection Rules Standard interconnection rules address the application process and specify technical requirements for interconnecting DG systems
Elements of Successful Implementation A number of best practices have emerged for effective implementation of standard interconnect rules. • http://www.naruc.org/associations/1773/files/dgiaip_oct03.pdf • http://www.energetics.com/madri/pdfs/inter_modelsmallgen.pdf
Leading State Examples • The Oregon PUC is in the process of developing uniform interconnection technical standards, procedures and agreements. They began the process in 2006 with the MADRI model rule and have initiated a stakeholder process to move forward. Currently, a draft Standard Small Generator Rule is open for comment. There have been several key improvements to the MADRI model rule: "field certification", non-inverter based Level 2 fast tracking up to 2 MW, and an increase of Level 1 to up to 25 kW. See: http://www.puc.state.or.us/PUC/admin_rules/intercon.shtml • New York was one of the first states to issue standard interconnection requirements for DG systems. Enacted in 1999, the initial requirements were limited to DG systems rated up to 300 kW connected to radial distribution systems. New York modified these interconnection requirements to include interconnection to radial and secondary network distribution systems for DG with capacities up to 2 MW. See: http://www.dps.state.ny.us/distgen.htm. • In November 1999, the Texas Public Utility Commission adopted substantive rules that apply to interconnecting generation facilities up to 10 MW. This ruling applies to both radial and secondary network systems. The rules require that Texas utilities evaluate applications based on pre-specified screening criteria, including equipment size and the relative size of the DG system to feeder load. These rules are intended to streamline the interconnection process for applicants. Texas ’s interconnection standards can be found in the Distributed Generation Interconnection Manual, available at: http://www.puc.state.tx.us/electric/business/dg/dgmanual.pdf
EPA Interconnection Resources • EPA Clean Energy-Environment Guide to Action • Chapter 5.4 – Interconnection Standards • http://www.epa.gov/cleanenergy/stateandlocal/guidetoaction.htm • EPA Fact Sheet: Standardized Interconnection Rules An Effective Policy to Encourage Distributed Generation • http://www.epa.gov/chp/state_resources/interconnection.htm • Survey of Interconnection Rules. Prepared by the Regulatory Assistance Project for EPA • http://www.epa.gov/chp/pdf/survey_interconnection_rules121806.pdf
Introduction Standardized Interconnection Rules Utility Standby Rates Renewable Portfolio Standards Contact Information
Utility Rates and Clean Energy (1 of 2) Electric utilities may have rate structures that create barriers to the development of clean distributed generation.
Utility Rates and Clean Energy (2 of 2) States are employing strategies to avoid undue barriers and reap the benefits of clean DG while providing utilities with appropriate cost recovery.
Elements of Successful Implementation Best practices have emerged based on state experiences.
Leading State Examples • California and New York have established revised standby rate structures that ensure fair and reasonable treatment of clean DG. Other states have adopted exit fee exemptions for existing loads that leave a utility's distribution system. Illinois, Massachusetts, and New York allow certain levels of exemption from these fees for loads that are replaced by clean DG, specifically CHP and renewables. • In 2004, the Oregon Public Utilities Commission approved a settlement regarding Portland General Electric Company’s tariffs for partial requirements customers. The load served by the on-site generation is treated in the same manner as any other load on the system, which under Oregon rules is obligated to have (or contract for) its share of contingency reserves. The on-site generation is, in effect, both contributing to and deriving benefits from the system’s overall reserve margin. Under the new rates, the partial requirements customer must pay or contract for contingency reserves equal to 7.0 percent (3.5 percent each for spinning and supplemental reserves) of the “reserve capacity” (i.e., either the nameplate capacity of the on-site unit or the amount of load it does not want to lose in case of an unscheduled outage; if the customer is able to shed load at the time its unit goes down, then it will be able to reduce the amount of contingency reserves it must carry). A similar pricing package has been adopted by PacifiCorp. • Three states have established special gas rates for electric generators, including CHP projects. California has special gas tariffs for all electric generators. In 2003, the New York PSC ordered natural gas companies to create a rate class specifically for DG users and certify that they had removed rate-related barriers to DG. In 2005, the Connecticut Energy Independence Act included a provision that the natural gas delivery charges for customer-sited DG be waived and those costs recovered by the electric distribution company.
EPA Rates Resources • EPA Clean Energy-Environment Guide to Action • Chapter 6.3 – Emerging Approaches: Removing Unintended Utility Rate Barriers to Distributed Generation • Chapter 6.2 - Utility Incentives for Demand-Side Resources • http://www.epa.gov/cleanenergy/stateandlocal/guidetoaction.htm • EPA Fact Sheet: Utility Rates-Designing Rates to Level the Playing Field for Clean Energy Supply • http://www.epa.gov/chp/state_resources/utility.htm • National Action Plan for Energy Efficiency1 • Chapter 2 - Utility Ratemaking & Revenue Requirements • http://www.epa.gov/cleanenergy/actionplan/report.htm 1. Facilitated by EPA and DOE
Introduction Standardized Interconnection Rules Utility Rates Renewable Portfolio Standard Contact Information
Renewable Portfolio Standards (RPS) and Clean Energy • Policy Objective: RPS requirements create market demand for clean energy supply by mandating that utilities and electricity providers serve load with a minimum requirement of clean energy. • Policy Advantages: • Due to market-based approach, has potential to achieve policy objectives efficiently and at relatively modest cost (ratepayer impacts generally range from less than 1% increases to 0.5% savings). • Spreads compliance costs among all customers. • Functions in both regulated and unregulated state electricity markets. • Provides a clear and long-term target for clean energy generation that can increase investors’ and developers’ confidence in the prospects for renewable energy.1 1. Provided the state sends strong signals that this is a policy that will last.
As of December 2006, RPS requirements have been established in 21 states plus the District of Columbia. Five of these states include CHP or waste heat recovery as an eligible resource.. States With RPS Requirements (1 of 2) States with RPS Requirements = CHP/waste heat recovery Source: Navigant Consulting, Inc., Database of State Incentives for Renewable Energy (DSIRE) and California Energy Commission. Notes: In Minnesota the RPS is mandatory for the largest utility, Xcel, however, for the rest of the utilities and service providers it is a “good faith effort”. Under a separate agreement, and in addition to the RPS requirements, Xcel is required to build or contract for 125 MW of biomass electricity, and must build or contract for 1,125 MW of wind by 2010. In addition, Illinoishas established a non-mandatory state goal for renewable energy. Arizona explicitly includes renewably fueled CHP systems
States with RPS requirements mandate that between 1 – 25%1 of electricity be generated from renewable sources by a specified date. States With RPS Requirements (2 of 2) Note: 1. Higher percentages are typically for states that already have a relatively large amount of RE, like NY, CA and ME Source: Navigant Consulting, Inc, Database of State Incentives for Renewable Energy (DSIRE) and California Energy Commission.
Key Features of RPS Design? (1 of 3) States tailor RPS requirements to fit policy objectives, electricity market conditions and renewable potential. The overall design of RPS requirements can influence investor confidence, the ability of markets to develop, and opportunities for project developers and investors to recover capital investments.
Key Features of RPS Design? (2 of 3) Eligibility of technologies varies by state and depends on whether an energy resource or technology supports state goals.
Key Features of RPS Design? (3 of 3) Several best practices for RPS design features have emerged based on state experiences.
Elements of Successful Implementation A number of best practices have emerged for implementing effective RPS requirements based on state experiences.
Leading State Examples • The legislation for California’s RPS requirements was enacted in September 2002. California’s RPS requirements originally required retail sellers of electricity to purchase 20% renewable electricity by 2017. Because of perceived significant IOU progress towards this goal, California accelerated this goal of 20% renewables to 2010 and set the state's 2020 goal at 33%. Retail sellers of electricity are required to increase their procurement of eligible renewable-energy resources by at least 2% per year, so that 20% of their retail sales are procured from eligible renewable energy resources by 2010. http://www.energy.ca.gov/portfolio/index.html • The Connecticut RPS was originally promulgated in 1998 and took effect July 1, 2000, establishing requirements for two classes of renewable generating resources. In June 2005, Connecticut passed “An Act Concerning Energy Independence,” establishing a new RPS Class III that must be fulfilled with CHP and electricity savings from Conservation and Load Management programs. The new standard will require electric suppliers and distribution companies to obtain 1% of their generation from Class III resources beginning in 2007 and increasing by 1% per year until leveling out at 4% in 2010 and thereafter. The total RPS requirement started at 4% in 2004 and will rise to and remain at 14% in 2010 and thereafter (including the new Class III). http://www.cga.ct.gov/2005/ACT/PA/2005PA-00001-R00HB-07501SS1-PA.htm.
EPA RPS Resources • EPA Clean Energy-Environment Guide to Action • Chapter 5.1 – Renewable Portfolio Standards • http://www.epa.gov/cleanenergy/stateandlocal/guidetoaction.htm • EPA Fact Sheet: Renewable Portfolio StandardsAn Effective Policy to Support Clean Energy Supply • http://www.epa.gov/chp/state_resources/rps.htm • EPA white paper: Energy Portfolio Standards and the Promotion of Combined Heat and Power • Forthcoming
EPA CHP Partnership Voluntary program that seeks to reduce the environmental impact of power generation by promoting the use of CHP. Facilitate CHP Project • Identification • Development • Implementation • Recognition www.epa.gov/chp
EPA Initiatives • Several initiatives focused on assisting state policy makers, including utility commissions, with promoting clean energy. • EPA Utility Commission Assistance • EPA Clean Energy-Environment State Partnership Program • State Energy Efficiency and Renewable Energy Projects (EE/RE Projects) • National Action Plan for Energy Efficiency
Utility Commission Technical Assistance • The aim is to assist state utility commissions in identifying and evaluating policies and programs that promote/support the deployment of clean DG. • Focus on state utility commission rules and policies that significantly affect the deployment of customer-sited clean DG • Interconnection standards • Standby rates • Eligibility requirements of Energy Portfolio Standards.
Clean Energy-Environment State Partnership Program • Voluntary Partnership that supports state efforts to increase the use of clean energy • States work across their relevant agencies to develop and implement a comprehensive strategy for using existing and new energy policies and programs to promote clean energy sources. • State Partners: CA, CO, CT, GA, MA, MN, NJ, NM, NY, NC, OH, PA, TX and UT.
EPA-State Energy Efficiency and Renewable Energy (EERE) Projects • Joint initiative between the EPA, NARUC, and individual state utility commissions designed to explore approaches that deliver significant energy cost savings and other benefits through greater use of EE and DG/RE/CHP. • The Projects explore a range of approaches, for encouraging EE and clean energy resources within state utility commission processes based on specific state interests. • Efforts include: • Efficiency workshops • Rate design • Interconnection • Resource planning • Transmission & distribution planning. • State Partners: AR, CT, DC HI, MN, NJ and NM.
National Action Plan for Energy Efficiency • The Action Plan presents policy recommendations for creating a sustainable, aggressive national commitment to energy efficiency through gas and electric utilities and partner organizations. • The Action Plan was being developed by a Leadership Group of more than 50 leading organizations representing key stakeholder perspectives in setting policy for our electricity and natural gas services, including senior utility officials, state utility regulators, consumer advocates, environmental groups, and large end-users. • Florida PSC recently endorsed the Action Plan! • Facilitated by EPA and DOE.
Summary • Numerous opportunities for Florida to increase use of clean energy! • Two key barriers that the PSC can address: interconnection standards and standby rates. • Successful states have found the importance of leadership at the PSC. • EPA can provide assistance to the PSC. www.epa.gov/cleanenergy
For More Information Katrina Pielli US Environmental Protection Agency Clean Energy Program Manager (202) 343-9610 Pielli.Katrina@epa.gov www.epa.gov/cleanenergy Ted Bronson Power Equipment Associates President (630) 248-8778 TLBronsonPEA@aol.com www.peaonline.com