Download
1 / 30
300 likes | 471 Views
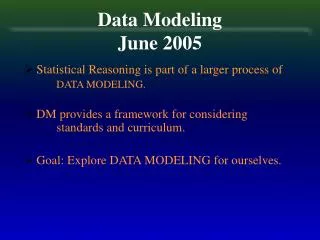
Data Modeling June 2005. Statistical Reasoning is part of a larger process of DATA MODELING. DM provides a framework for considering standards and curriculum. Goal: Explore DATA MODELING for ourselves. Cycle of Data Modeling. Question. Attribute. Measure. Structure. Summarize

E N D
Data Modeling June 2005 • Statistical Reasoning is part of a larger process of DATA MODELING. • DM provides a framework for considering standards and curriculum. • Goal: Explore DATA MODELING for ourselves.
Cycle of Data Modeling Question Attribute Measure Structure Summarize (Stats) Represent (Graphs) Inference Revise Question
How Do You Wake Up? Angie Putz, Grade 1
Soup Survey The cafeteria now serves CNS more than Tomato
Angie’s Reflections • Questions revised in light of data collection and organization (The soup survey, Fruit flies) • The idea of attribute and collection--forming collections like “other” or “animal” instead of “dog.” • The constraints imposed by paper and children’s efforts to resolve them. • The importance of conversation about the representation: What’s it good for?
Developing Graphical Sense Jennie Clement, Grade 2 Where would you prefer to live, the tall city or the wide country?
Jennie’s Reflections • Children’s ideas begin with literal depictions and over time, representations become more “distant” from the event. • Developed a scoring rubric to “capture my senses of the similarities and differences in children’s work as they progress from literal copy to graphical representation.” • The importance of conversation about the uses and needs of conventions like equal intervals, choices among graphs in relation to questions.
Graphing Excitement Deb Lucas, Grade 6 How do writers create and sustain interest?
Deb’s Reflections • Using data displays to direct inquiry. • Graphical literacy as a tool for developing textual literacy. • Relations between mathematical and textual literacies..
Who’s the Artist? Erin diPerna, Grade 3
Developing Classification Models Which attributes should be measured and how? Data abstraction (15 eye shapes ---> 3) Analysis and display to generate relative odds Models for combining attributes to predict the age of the artist. Testing and Revising Models Further refinement
Customizing Sally Hanner (g 4), Eric James (g 1-2), Mark Rohlfing (g 5) Developmental comparisons by teachers of younger and older children.
Our Agenda: Thinking about Variation • CONTEXTS FOR THINKING ABOUT VARIATION • MEASUREMENT • NATURE (Warner Park) • TOOLS FOR FINDING PATTERN • Drawing, Writing • Tinkerplots
Agenda (con’t) • MODELING VARIATION - Sample-to-Sample Variation - Chance devices • MAKING INFERENCE • CURRICULUM INVESTIGATIONS
DAILY SCHEDULE • Monday • Measure Height of Flagpole (Vary Tools, Units) • Display Measurements • Create Summaries of Data (Statistics) • Explore Measures with Tinkerplots • Wrap-up
Schedule • Tuesday • - Warner Park Studies (AM) • How diverse is a section of the forest? • Working up our WP data (PM) • Wednesday • What would happen if we did it again? • Modeling measurement as Measure + Chance • Rockets Red Glare (Inference)
Schedule • Thursday • - Warner Park Field Studies Redux (AM) • - Working Up the Data (PM) • Friday • Science-at-Work and Classroom Implications • Curriculum Studies • Wrap Up