Download
1 / 1
10 likes | 142 Views
Prostate motion in Radial Distance (cm). Time. 2000 2001 2002. M. S. A. S. A. L. L. R. R. P. I. I. view from AP (b) view from RL (c) view from IS (patient’s feet).

E N D
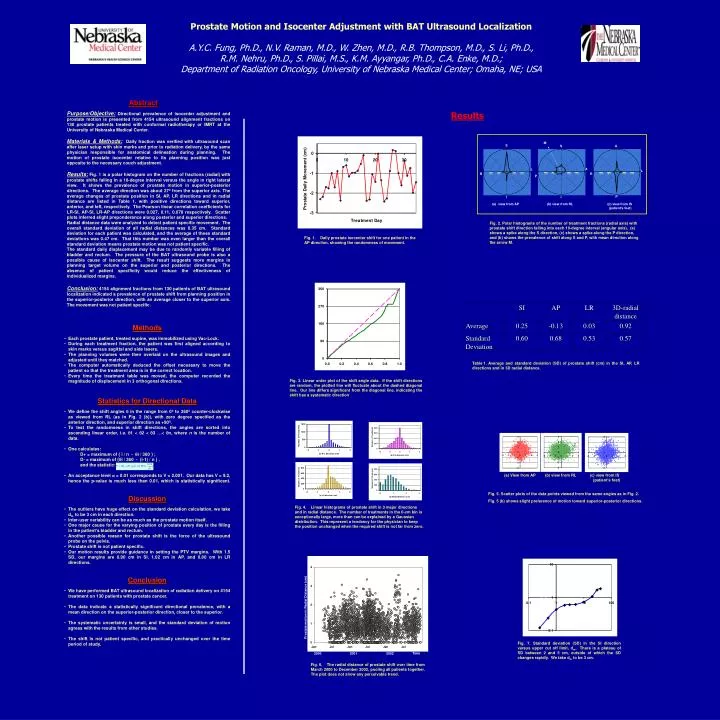
Prostate motion in Radial Distance (cm) Time 2000 2001 2002 M S A S A L L R R P I I • view from AP (b) view from RL (c) view from IS • (patient’s feet) Prostate Motion and Isocenter Adjustment with BAT Ultrasound Localization A.Y.C. Fung, Ph.D., N.V. Raman, M.D., W. Zhen, M.D., R.B. Thompson, M.D., S. Li, Ph.D., R.M. Nehru, Ph.D., S. Pillai, M.S., K.M. Ayyangar, Ph.D., C.A. Enke, M.D.; Department of Radiation Oncology, University of Nebraska Medical Center; Omaha, NE; USA Abstract Purpose/Objective: Directional prevalence of isocenter adjustment and prostate motion is presented from 4154 ultrasound alignment fractions on 130 prostate patients treated with conformal radiotherapy or IMRT at the University of Nebraska Medical Center. Materials & Methods: Daily fraction was verified with ultrasound scan after laser setup with skin marks and prior to radiation delivery, by the same physician responsible for anatomical delineation during planning. The motion of prostate isocenter relative to its planning position was just opposite to the necessary couch adjustment. Results: Fig. 1 is a polar histogram on the number of fractions (radial) with prostate shifts falling in a 10-degree interval versus the angle in right lateral view. It shows the prevalence of prostate motion in superior-posterior directions. The average direction was about 27º from the superior axis. The average changes of prostate position in SI, AP, LR directions and in radial distance are listed in Table 1, with positive directions toward superior, anterior, and left, respectively. The Pearson linear correlation coefficients for LR-SI, AP-SI, LR-AP directions were 0.027, 0.11, 0.078 respectively. Scatter plots inferred slight preponderance along posterior and superior directions. Radial distance data were analyzed to detect patient specific movement. The overall standard deviation of all radial distances was 0.35 cm. Standard deviation for each patient was calculated, and the average of these standard deviations was 0.47 cm. That this number was even larger than the overall standard deviation means prostate motion was not patient specific. The standard daily displacement may be due to randomly variable filling of bladder and rectum. The pressure of the BAT ultrasound probe is also a possible cause of isocenter shift. The result suggests more margins in planning target volume on the superior and posterior directions. The absence of patient specificity would reduce the effectiveness of individualized margins. Conclusion: 4154 alignment fractions from 130 patients of BAT ultrasound localization indicated a prevalence of prostate shift from planning position in the superior-posterior direction, with an average closer to the superior axis. The movement was not patient specific. Results P Fig. 2. Polar histograms of the number of treatment fractions (radial axis) with prostate shift direction falling into each 10-degree interval (angular axis). (a) shows a spike along the S direction, (c) shows a spike along the P direction, and (b) shows the prevalence of shift along S and P, with mean direction along the arrow M. Fig. 1. Daily prostate isocenter shift for one patient in the AP direction, showing the randomness of movement. • Methods • Each prostate patient, treated supine, was immobilized using Vac-Lock. • During each treatment fraction, the patient was first aligned according to skin marks versus sagittal and side lasers. • The planning volumes were then overlaid on the ultrasound images and adjusted until they matched. • The computer automatically deduced the offset necessary to move the patient so that the treatment area is in the correct location. • Every time the treatment table was moved, the computer recorded the magnitude of displacement in 3 orthogonal directions. • Statistics for Directional Data • We define the shift angles in the range from 0º to 360º counter-clockwise as viewed from RL (as in Fig. 2 (b)), with zero degree specified as the anterior direction, and superior direction as +90º. • To test the randomness in shift directions, the angles are sorted into ascending linear order, i.e. 1 < 2 < 3 …< n, where n is the number of data. • One calculates: • D+ = maximum of { i / n - i / 360 } ; • D- = maximum of {i / 360 - (i-1) / n } , • and the statistic: • An acceptance level = 0.01 corresponds to V = 2.001. Our data has V = 9.2, hence the p-value is much less than 0.01, which is statistically significant. • Discussion • The outliers have huge effect on the standard deviation calculation, we take dm to be 3 cm in each direction. • Inter-user variability can be as much as the prostate motion itself. • One major cause for the varying position of prostate every day is the filling in the patient's bladder and rectum. • Another possible reason for prostate shift is the force of the ultrasound probe on the pelvis. • Prostate shift is not patient specific. • Our motion results provide guidance in setting the PTV margins. With 1.5 SD, our margins are 0.90 cm in SI, 1.02 cm in AP, and 0.80 cm in LR directions. • Conclusion • We have performed BAT ultrasound localization of radiation delivery on 4154 treatment on 130 patients with prostate cancer. • The data indicate a statistically significant directional prevalence, with a mean direction on the superior-posterior direction, closer to the superior. • The systematic uncertainty is small, and the standard deviation of motion agrees with the results from other studies. • The shift is not patient specific, and practically unchanged over the time period of study. Table 1. Average and standard deviation (SD) of prostate shift (cm) in the SI, AP, LR directions and in 3D radial distance. Fig. 3. Linear order plot of the shift angle data. If the shift directions are random, the plotted line will fluctuate about the dashed diagonal line. Our line differs significant from the diagonal line, indicating the shift has a systematic direction. • View from AP (b) view from RL (c) view from IS (patient’s feet) Fig. 5. Scatter plots of the data points viewed from the same angles as in Fig. 2. Fig. 5 (b) shows slight preference of motion toward superior-posterior directions. Fig. 4. Linear histograms of prostate shift in 3 major directions and in radial distance. The number of treatments in the 0-cm bin is exceptionally large, more than can be explained by a Gaussian distribution. This represent a tendency for the physician to keep the position unchanged when the required shift is not far from zero. Standard deviation of prostate motion (cm) Upper cut off limit of data (cm) Fig. 7. Standard deviation (SD) in the SI direction versus upper cut off limit, dm. There is a plateau of SD between 2 and 5 cm, outside of which the SD changes rapidly. We take dm to be 3 cm. Fig. 6. The radial distance of prostate shift over time from March 2000 to December 2002, pooling all patients together. The plot does not show any perceivable trend.