Download
1 / 43
430 likes | 637 Views
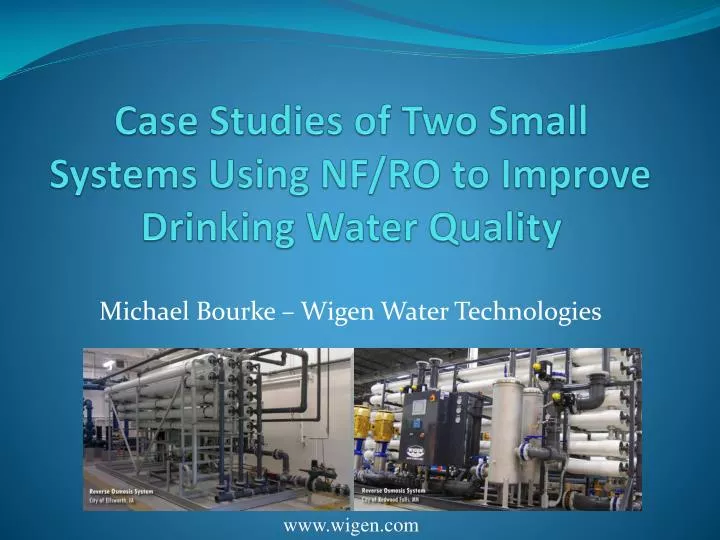
Case Studies of Two Small Systems Using NF/RO to Improve Drinking Water Quality. Michael Bourke – Wigen Water Technologies. www.wigen.com. Potable Applications of NF/RO. Aesthetic TDS Hardness Sulfate Color. Regulatory Nitrate Arsenic Radionuclides Fluoride Selenium Pesticides

E N D
Case Studies of Two Small Systems Using NF/RO to Improve Drinking Water Quality Michael Bourke – Wigen Water Technologies www.wigen.com
Potable Applications of NF/RO • Aesthetic • TDS • Hardness • Sulfate • Color • Regulatory • Nitrate • Arsenic • Radionuclides • Fluoride • Selenium • Pesticides • Heavy Metals
Pressure Membrane Feed Water Permeate Concentrate Membrane separation is a process in which properly pretreated source water is delivered at moderate pressures against a semipermeable membrane. The membrane rejects most solute ions and molecules, while allowing water of very low mineral content to pass through.
Feed Water Concentrate Spacer Material Permeate Carrier Material Permeate Membrane Material The most common RO membrane material today is aromatic polyamide, typically in the form of thin-film composites. They consist of a thin film of membrane bonded to layers of other porous materials that are tightly wound to support and strengthen the membrane.
1. Feed water characteristics - Cations - Anions - Silt Density Index (SDI) - Temperature - Oxidants 2. Pre-treatment requirements - Mechanical and/or chemical - Solids removal (turbidity < 1 NTU) - Fe/Mn removal - Anti-scalant and sodium bisulfite dosing 3. Determine desired permeate quality & flow - Membrane selection - Recovery achievable/waste volume - Amount of bypass 4. O&M Requirements - Power & Pretreatment chemicals - Cartridge filter replacement - CIP Chemicals - Membrane Replacement
Cleaning Frequency? • 10-15% increase in normalized differential pressure • 10-15% decrease in normalized permeate flow • 10-15% decrease in permeate quality • Prior to sanitization • Regular Maintenance Schedule • Every 3 to 12 months
Case Studies • City of Wellman, IA • New RO System for Radium & Ammonia Removal and General Water Quality Improvement. • City of Creighton, NE • Upgraded RO System to Improve Nitrate Removal.
Case Study #1:RO Pilot Study Evaluates Removal of TDS, Sulfate, Ammonia and Radionuclides at Wellman IA Background Trial Objectives Pilot Plant Selection Results Full-scale System Design
Wellman, Iowa • Population ~1400 • Groundwater supply • Greensand Filters • DW violations for: • Nitrite • Combined radium
Trial Objectives • Three month trial required by IA DNR. • Demonstrate RO system performance on a pilot plant representative of a full-scale system. *EPA Primary DW Regulation #EPA Secondary DW Regulation
Pilot Criteria • Representative of Full-scale Design • Average flux rates • Array Length (6L) – representative flux per element • Membrane element diameter/type • Representative Pre-treatment • Filtration • Fe/Mn Removal • Chemical Dosing • Representative Feed Water
Pilot Plant Set-up Concentrate S2 Feed S1 Feed (elements 4-6) S1 Feed (elements 1-3) 2-2:1-1, 3-Long Pilot Plant, Simulates 2:1, 6-Long System
Trial Design • Duration – cover minimum CIP frequency • Data Collection • Automatic (pressure, flows, conductivity, temperature) • Normalized data to monitor system performance, early signs of fouling or membrane damage. • Manual (feed, permeate & concentrate samples) • Membrane Autopsy • Detect/identify cause of fouling (lead and end elements)
Data Normalization Takes changes in pressure and temperature and then normalizes, or adjusts, the recorded permeate flow rate accordingly. • Graphically shows the permeate flow rate without the effects temperature • Indicates the need for cleaning • Helps troubleshoot system
Trial Results Potential Membrane Damage No decrease = minimal fouling
Trial Results CIP Performed
Trial Results • 98.9% TDS Reduction • 16-28 mg/L • 99.9% Hardness Reduction • 0.9-2.0 mg/L as CaCO3 (slight increase in last week)
Trial Results • 99.94% Sulfate Reduction • 0.9-4.2 mg/L (slight increase in last week) • Below detection (<0.09 mg/L)
Membrane Autopsies • First membrane in bank 1 and last in bank 2 • No visible signs of fouling. • ∆P and Flowrate within acceptable ranges • Conductivity rejections of 97.3% & 97.1% below spec of 99.5% - possible chlorine damage. • Fujiwara test was positive for halogen on membranes indicating oxidative attack.
Results Summary • TDS, sulfate, hardness & ammonia reduced to well below targets. • Combined radium (226/228) reduced to below detection <1.0 pCi/L (feed levels only ~2.0 pCi/L during trial). • Increase in permeate flow and some salts determined to be due to chlorine oxidation. Possible chlorine peaks in feed or loss of sodium bisulfite dosing. • No fouling experienced over trial period with 2.3 mg/L dose of Vitec 3000, and CIP frequency likely to be every 4-6 months.
Full-Scale Design • Two x 100 gpm RO skids • 20% Bypass stream • Design flux of 14.4 GFD & 75% recovery • Array: 3:1, 6-Long • Toray TMG20-400 membranes • ORP meter on feed to shut down RO on detection of Cl2 residual. • Waste to sewer.
Full-Scale Installation July 2011
Case Study #2:Upgrade of Creighton’s RO System brings City back in to Compliance with Nitrate MCL Background RO System Capabilities for NO3 Removal & Factors Impacting Performance Overhaul of City’s RO System System Performance – Before & After
City of Creighton • Population ~1200 • Groundwater supply • Raw Water Nitrate 15-20 mg/L
RO System History – First in NE • Installed in 1993 – first RO system in Nebraska • Two skids each with two RO trains. • Array per RO train: • 3:2, 6-long • Feed: 130 gpm per train • Permeate: 100 gpm per train (76% recovery)
Water Treatment Plant Bypass – 125 gpm RO Train 1 RO Train 2 Well Pumps Finished Water 525 gpm Greensand Filters RO Train 3 Permeate 400 gpm RO Train 4 RO Concentrate 120 gpm
RO System History • Bypass: 50% reduced to 25% with increasing raw water nitrate levels to stay in compliance. • Trains 1 & 2 historically had significantly more use: • Membranes replaced most recently in 1 & 2 due to greater TDS and nitrate leakage. • No improvement in Train 1 and 2 performance after membrane replacement. • System placed on compliance order in early 2011 – given 90 days to get in compliance.
WWT Investigation • Projection conducted for Toray TMG20N-400C low energy RO membranes. • With 20 mg/L NO3-N in feed, theoretical permeate level was 1.67 mg/L. • Nitrate from trains 1 & 2 was >5.0 mg/L. • Determined that reconditioned RO membranes had been recently installed in trains 1 and 2. • Typically used for hardness removal • Not suitable for nitrate removal
Recommendations • Install Toray Low Energy Membranes (TMG20N-400C) in worst performing trains (1 & 2). • Fastest and lowest cost to get system back in compliance. • Future: • Replace existing pumps with more efficient low energy pumps. • Replace membranes in trains 3 & 4.
Individual Train Performance Trains 1 & 2 Membranes Replaced
Overall Nitrate Removal Data Trains 1 & 2 Membranes Replaced
Individual Train Performance Trains 1 & 2 Membranes Replaced
Low Energy Membrane Savings Previous RO Membranes: Operating Pressure: 150 psi Pump Power: 20 HP per train Annual Power Cost*: $7,840 per train @ 10c/kWh Low Energy RO Membranes: Operating Pressure: 110 psi Pump Power: 15 HP per train Annual Power Cost*: $5,880 per train @ 10c/kWh Annual Power Savings: $7,840 (25% reduction) *Assuming 60% plant utilization
Process Economics Operating Costs: c/1000 gal Power 10.4 Chemicals# & cartridge filters 14.9 Membrane replacement (5 years) 16.5 Total* 41.8 #Bisulfite, antiscalant, CIP chemicals *Assuming 60% plant utilization, 75% recovery & 20% bypass.
Results Summary • Determined that reconditioned membranes were not effectively removing nitrate and resulting in MCL violations. • Replacement of train 1& 2 membranes immediately brought system back in to compliance. • Low energy membranes will save City ~$8000 per year in pumping power. • Don’t assume any RO membrane can remove >90% nitrate!
Questions? www.wigen.com