Download
1 / 50
500 likes | 599 Views
CYFERnet Evaluation. CYFAR Evaluation Team Presented at the 2009 CYFAR SCP Orientation Meeting June 9, 2009 Washington, DC. Team Members. University of Arizona Lynne Borden Christine Bracamonte Wiggs Virginia Tech Lydia Marek Jay Mancini. Overview of Session.

E N D
CYFERnet Evaluation CYFAR Evaluation Team Presented at the 2009 CYFAR SCP Orientation Meeting June 9, 2009 Washington, DC
Team Members University of Arizona Lynne Borden Christine Bracamonte Wiggs Virginia Tech Lydia Marek Jay Mancini
Overview of Session • Role of CYFERnet evaluation • CYFERnet tools • CYFERnet resources • Upcoming CYFERnet activities • Overview of clusters • Logic model construction and implementation • Small group assistance and support
Role of CYFERnet Evaluation GOALS • Evaluate the impact of CYFAR-funded programs and provide evaluation and sustainability resources and assistance to state and community programs • Provide an internet-based network of evaluation resources and technical assistance organized around the areas of Citizenship, Parenting, Healthy Living, Work Force Preparation, Communication Skills, and SET • Collect data that offers a collective story about how CYFAR SCPs are contributing to the well-being of children, youth, and families nationwide
CYFERnet Tools CYFERnet Evaluation Site: http://www.cyfernet.org/index.php?c=6
CYFERnet Resources • The "tip of the week“ is Tools of the Trade • This tool is focused on assisting you in selecting the best tools for your evaluation On-Line Resources Offers Information On: • Designing a Program Evaluation • Process Evaluation Tools and Instruments • Outcome Evaluation Tools and Instruments • Data Analysis and Reporting
Evaluating Early Childhood Outcomes • Evaluating School Age Outcomes • Evaluating Teen Outcomes • Evaluating Parent/Family Outcomes • Evaluating Community Outcomes • Evaluating Organizational Capacity • Evaluating Technology Use • Evaluating Program Sustainability Building Capacity for Evaluation
Upcoming CYFERnet Activities • What to watch for: • Common measures assessment • e-community • Webinars • Organizational change study • Sustainability studies
Organizational Change Study • Document the current state of and changes in states' abilities to develop and sustain effective programs for children, youth and families at risk. • The survey measures: • Vision and strategic plan for children, youth and family programming; • Train, support and reward Extension staff for programming that accomplishes the CYFAR mission; • Recognize Extension professionals as critical resources; • Promote diversity, inclusivity and pluralism in Extension programs and staff; • Promote internal and external collaborations to strengthen programs and policy for children, youth and families.
The National Program Sustainability Studies • Our goal in conducting these studies were twofold: • To understand what contributes to sustaining community-based programs for at-risk youth and families. • To develop and transform that understanding into usable products for program professionals and researchers.
Our Definition of Sustainability A sustained project: • has programs and services that are maintained continuously over time and • keeps a focus consonant with its original goals and objectives, including the individuals, families, and communities it was originally intended to serve.
Purpose of Current NCP Study • To identify the extent of sustainability of NCP CYFAR programs that have been off of CYFAR funding for 1-2 years, including how they are being sustained, the level of sustainability, the functioning of the programs with regard to dimensions of sustainability, and the role of Land Grant Universities in sustaining these projects.
Methods • NCP Project Directors (for those projects who are one and two years post CYFAR funding) were contacted and asked to complete a shorter version of the Sustainability Survey. • 14 states completed their five years of USDA-CSREES New Communities Funding in September 2000 or 2001 with an additional 10 states completing their funding in September 2002. • A point of contact for each of the 24 states was identified via their program closeout reports and then confirmed with CSREES-USDA. All states responded and provided at least some information except for the state of Michigan. • Results reported are based on 23 projects except for the percentage of sustained projects which is reported for all projects. [For the purposes of this report, we make the assumption that Michigan is no longer active as no response was received although multiple attempts were made to gather this information.]
Findings: Program Activity • Almost all (n=22/24 or 92%) projects continue to be active one, or two, years post CYFAR/USDA funding (with the assumption that the status of Michigan’s project is inactive). Of the 22 active projects: • 26% reported expanded activities. • 30% reported that activity levels were maintained. • 44% reported reduced activities.
One project that reported reduced activities went on to state: • “…With no increase in local funding for what is considered “non-traditional funding” and with organizational downsizing, all totaled have resulted in these projects being for the most part, discontinued in three of the four sites.” • Others reflected on the current project: • “At the beginning of the CYFAR project, we had no idea this is what it would look like today, but I think it looks even better than we thought. We have greatly expanded our influence and raised capacity at school sites all over town.”
Findings: Perceived Sustainability • More than half (56%) of the projects are perceived “Mostly” (43%) to “Completely” (13%) sustained and 39% are “partially” sustained. Only one of the 23 projects reporting was “not at all” sustained.
Findings: Ability of the Project to Meet the Needs of At-Risk Youth and their Families • Almost three-quarters (74%) of active projects reported that their project was “Mostly” (48%) to “Fully” (26%) meeting the needs of at risk children, youth, and/or families while 26% reported “Somewhat” meeting their needs.
Sustainability Planning • When asked when their project began actively planning for project survival, more than half (57%) reported planning during the initial project proposal or during the first year. An additional 35% began planning during the second or third year of funding and only two projects began planning during their fourth year of funding. • Successful projects reported:
“(We) planned from the time of proposal writing to the end of the project funding.” • “The plan for a well thought out community development project with fiscal and program sustainability institutionalized from the proposal stage.”
Next Steps in Sustainability Research • Continue collecting data from NCP projects that are no longer funded. • Begin collecting sustainability planning information from funded SCP projects to expand the knowledge base of sustaining community-based programming.
Youth Citizenship • Global indicator: • Number of youth and adults reporting increased readiness for effective youth- adult interactions as a result of participating in the program • Number of youth acquiring leadership skills or knowledge as a result of participating in the program States: *California, *Hawaii, *Florida,*Georgia, *Indiana, *Maine *Denotes state has more than one focus area
Parenting • Global indicator: • Number of parents, grandparents, or caregivers who gain knowledge or skills in child development as a result of participating in the program States: *California, *Pennsylvania,Nebraska, *North Carolina A&T, Washington *Denotes state has more than one focus area
Healthy Living • Global indicator: • Number of youth making behavioral changes in diet or physical activity for the purpose of improving health States: Alabama/Tuskegee,*Florida A&M, *Hawaii, West Virginia State, *Maine, *North Carolina A&T *Denotes state has more than one focus area
Workforce Preparation • Global indicator: • Number of youth acquiring work-related life skills as a result of participating in the program State: *Georgia *Denotes state has more than one focus area
Communication Skills • Global indicator: • Number of youth improving communication skills as a result of the program States: *California, *Florida A&M,*Massachusetts, *New Jersey, Pennsylvania, Virgin Islands, *Florida, *Indiana, *Maine *Denotes state has more than one focus area
SET • Global indicator: • Number of youth increasing science literacy as a result of the program States: *California, *Hawaii,*Massachusetts, *New Jersey,North Dakota, *Oregon, Texas,West Virginia, *Georgia, *Denotes state has more than one focus area
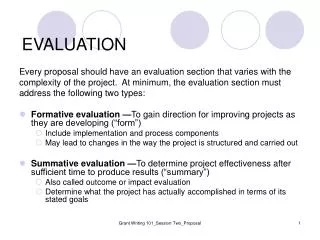
Introduction • Across the United States there are a multitude of programs designed to improve the quality of life for individuals, families, and communities. • Evaluation is essential for successful programming to document what happens in the program, demonstrate which strategies work best, and assess the short-term and long-term outcomes of the program.
Introduction (cont’d) • Understanding how a program achieves results is critical to determine if program elements should be modified and provide stakeholders with evidence that the program is effective. • Evaluation theory provides the basic conceptual framework for thinking about problems and how change should occur. • Logic models provide valuable ways to organize that thinking around evaluation theory.
Logic Model • Program theory articulates program impact and program processes. • Logic models provide a visual picture of program theory in action (Mancini, Huebner, McCollum and Marek, 2005). • Of primary importance in developing logic models is establishing and maintaining a focus on results rather than on activities.
Logic Model (cont’d) • Logic models help program professionals, evaluators and stakeholders reach consensus about which elements are essential to the program (Millar, Simeone, & Carnevale, 2001; Orthner & Bowen, 2004). • Consequently program professionals and researchers are more able to identify faulty or implausible links early on.
SCP Logic Model The logic model you were asked to complete includes five elements: • Identified needs and assets, • Desired results (short term and long- term), • Indicators (short-term and long-term), • Activities, and • Resources.
Step 1: Identified Needs and Assets • The first step is to identify needs and assets in the community which allow program personnel to clearly identify and understand the issues. • Because this is the basis for the entire program, it is important to use accurate and valid information rather than uninformed hunches. • Be sure to look at needs and assets at many levels, from the community systems such as health, education, legal, etc. to families and to individuals.
Step 1: Identified Needs and Assets (cont’d) • Needs and assets analysis is a systematic way of gathering information that helps set priorities for action while also recognizing the assets that already exist in a community. • In the logic model process the information that evaluators are gathering to understand severity of a problem also assists them in determining program priorities, and results that accrue from program activities. • Census data, observations, records and existing data bases, and literature reviews are sources of existing information to identify needs and assets (Witkin & Altshuld, 1995).
Step 2: Desired Results • The second step in the logic model process is to articulate the desired result or change you expect to see because of your program. • This is arguably the most important aspect of a logic model because it provides the focus that all successful programs need. • At the completion of the program, what will be different?
Step 2: Desired Results (cont’d) • Results should be defined as short term and long term. • Specifying results is useful because it enables program professionals to have a more realistic sense of how parts of the program theory fit, and what can reasonably be expected to change over a specific time period. • Demonstrated results are not expected to be documented by following the same participants for five years, but rather are focused on all participants, or each group, as they complete participation in programs.
Changes in knowledge, attitudes, and/or behaviors that are anticipated as a result of participating in programs can be considered short-term results. These results should be reported at the end of each of the five years. Short Term Results
Long Term Results • System change or changes in organizations, community capacity, program support, and/or program sustainability may be considered long term results. • Progress toward long term results can be reported for each or any of the five years but MUST be reported in year 5.
Step 3: Indicators • Indicators flow logically from the desired results. How will you know if the results have been achieved, with what evidence? • By determining program indicators, program activities and results can be measured and tracked. Consequently notions, hunches, hearsay, and anecdotes are not good indicator candidates.
Step 3: Indicators (cont’d) • Indicators can be far-ranging, including results from surveys and focus groups, agency administrative data, population data, as well as other measures (DeVellis, 2003; McKillip, 1998). • Evaluation Work Sheets were also provided and completed to help you specify program indicators for each of your program goals.
Step 4: Activities • Activities describe programs that are implemented to achieve the desired results. • Program activities become important only when they are linked to desired results (Bowen, et al., 2001). • Attention to the choice of programs, research upon which it is based, population to be served and critical elements of successful programs must all be considered.
Step 5: Resources • Resources include the people, stakeholders, curricula, spaces, approvals, funds and any thing else needed to conduct the activities to achieve the desired results to meet the identified needs and capitalize on the available assets.
Monitoring and Evaluation • An important part of the logic model is how the intervention will be monitored and evaluated, including program implementation and its intended results. • Monitoring and evaluation permeate all parts of a logic model.
Monitoring and Evaluation (cont’d) • There are multiple objectives for monitoring and evaluation: • to identify the initial extent of need; • to track how the need may change over time; • to document how well program implementation protocols are being followed; • to mark progress toward achieving results; • to know when results have been met; and • to discern how resource use has supported particular program efforts and subsequent results.
Logic Model Worksheets • The Logic Model Work Sheets allow you to put your Program Logic Model to work for you. • These worksheets are provided to help you identify the anticipated results (short-term and long-term) for your program as well as indicators. • You will also need to detail the data collection process; sources of data, time of collection, and method of collection. • Finally, you will also note the analysis you anticipate conducting.
Questions? Comments?
Contact Information University of Arizona Lynne Borden: bordenl@ag.arizona.edu Christine Bracamonte Wiggs: cbmonte@email.arizona.edu Virginia Tech Lydia Marek: lmarek@vt.edu Jay Mancini: mancini@vt.edu