Download

1 / 21
210 likes | 326 Views
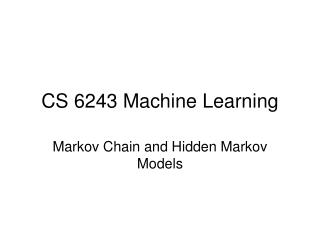
Dayhoff’s Markov Model of Evolution. Brands of Soup Revisited. P(B|A) = 2/7. Brand A. Brand B. P(A|B) = 2/7. Brands of Soup Revisited. Transition Diagram. P(B|A) = p = 2/7. Brand A. Brand B. P(A|B) = p = 2/7. Conditional Probability Formulas.

E N D
Brands of Soup Revisited P(B|A) = 2/7 Brand A Brand B P(A|B) = 2/7
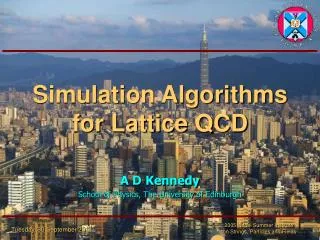
Brands of Soup Revisited Transition Diagram P(B|A) = p = 2/7 Brand A Brand B P(A|B) = p = 2/7 Conditional Probability Formulas P(Ak)= P(Ak-1) (1-p)+P(Bk-1 ) p = 5/7 P(Ak-1) + 2/7 P(Bk-1) P(Bk)= P(Ak-1 ) p + P(Bk-1) (1-p) = 2/7 P(Ak-1) +5/7 P(Bk-1)
Brands of Soup Revisited Transition Diagram P(B|A) = p = 2/7 Brand A Brand B P(A|B) = p = 2/7 Conditional Probability Formulas P(Ak)= P(Ak-1) (1-p)+P(Bk-1 ) p = 5/7 P(Ak-1) + 2/7 P(Bk-1) P(Bk)= P(Ak-1 ) p + P(Bk-1) (1-p) = 2/7 P(Ak-1) +5/7 P(Bk-1) Matrix Representation
Brands of Soup Revisited Transition Diagram P(B|A) = p = 2/7 Brand A Brand B P(A|B) = p = 2/7 Conditional Probability Formulas P(Ak)= P(Ak-1) (1-p)+P(Bk-1 ) p = 5/7 P(Ak-1) + 2/7 P(Bk-1) P(Bk)= P(Ak-1 ) p + P(Bk-1) (1-p) = 2/7 P(Ak-1) +5/7 P(Bk-1) Matrix Representation
Brands of Soup Revisited Transition Diagram P(B|A) = p = 2/7 Brand A Brand B P(A|B) = p = 2/7 Conditional Probability Formulas P(Ak)= P(Ak-1) (1-p)+P(Bk-1 ) p = 5/7 P(Ak-1) + 2/7 P(Bk-1) P(Bk)= P(Ak-1 ) p + P(Bk-1) (1-p) = 2/7 P(Ak-1) +5/7 P(Bk-1) Matrix Representation
Brands of Soup Revisited Transition Diagram P(B|A) = p = 2/7 Brand A Brand B P(A|B) = p = 2/7 Conditional Probability Formulas P(Ak)= P(Ak-1) (1-p)+P(Bk-1 ) p = 5/7 P(Ak-1) + 2/7 P(Bk-1) P(Bk)= P(Ak-1 ) p + P(Bk-1) (1-p) = 2/7 P(Ak-1) +5/7 P(Bk-1) Matrix Representation
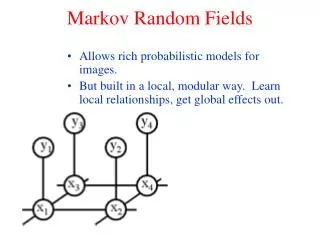
Markov Processes Can Be Represented by Matrices 1/2 e.g., a 3-state process: 1/3 1/4 Can be represented with this matrix:
Markov Matrix Properties • Sum of probabilities in a row must be 1 • No change = diagonal matrix • If well-behaved*, multiplying the matrix by itself many times converges to a limit • This limit matrix has identical column elements • The rows of the limit matrix are the “equilibrium probabilities” for the process *(1) Every state can transition to every other state at least indirectly, and (2) the least common denominator of any cycle in the transition diagram is 1
Ask Mathematica! Recall m =
Margaret Dayhoff • Had a large (for 1978) database of related proteins • Asked “what is the probability that two aligned sequences are related by evolution?” DAYHOFF, M. O., R. M. SCHWARTZ, and B. C. ORCUTT. 1978. A model of evolutionary change in proteins. (pp 345-352 inM. 0. DAYHOFF, ed. Atlas of protein sequence and structure. Vol. 5, Suppl. 3. National Biomedical Research Foundation, Washington, D.C.)
Dayhoff Model • Amino acids change over time independently of their position in a protein. (simplifying assumption) • The probability of a substitution depends only on the amino acids involved and not on the prior history (Markov model).
A Sequence Alignment (Example alignment from a BLAST search) >gi|1173266|sp|P44374|RS5_HAEIN 30S ribosomal protein S5 Length = 166 Score = 263 bits (672), Expect = 1e-70 Identities = 154/166 (92%), Positives = 159/166 (95%) Query: 1 MAHIEKQAGELQEKLIAVNRVSKTVKGGRIFSFTALTVVGDGNGRVGFGYGKAREVPAAI 60 M++IEKQ GELQEKLIAVNRVSKTVKGGRI SFTALTVVGDGNGRVGFGYGKAREVPAAI Sbjct: 1 MSNIEKQVGELQEKLIAVNRVSKTVKGGRIMSFTALTVVGDGNGRVGFGYGKAREVPAAI 60 Query: 61 QKAMEKARRNMINVALNNGTLQHPVKGVHTGSRVFMQPASEGTGIIAGGAMRAVLEVAGV 120 QKAMEKARRNMINVALN GTLQHPVKGVHTGSRVFMQPASEGTGIIAGGAMRAVLEVAGV Sbjct: 61 QKAMEKARRNMINVALNEGTLQHPVKGVHTGSRVFMQPASEGTGIIAGGAMRAVLEVAGV 120 Query: 121 HNVLAKAYGSTNPINVVRATIDGLENMNSPEMVAAKRGKSVEEILG 166 NVL+KAYGSTNPINVVRATID L NM SPEMVAAKRGK+V+EILG Sbjct: 121 RNVLSKAYGSTNPINVVRATIDALANMKSPEMVAAKRGKTVDEILG 166
Building a Markov Model • From the observed substitution data, Dayhoff et al. were able to estimate the joint probabilities of two amino acids substituting for eachother. This yields a big, diagonally symmetric matrix of probabilities. The diagonal elements Mab are close to 1. • But the matrix of joint probabilities, P(b∩a) does not represent a Markov process. Recall the elements of a Markov process’ matrix are conditional probabilities, P(b|a) = P(b∩a)/ P(a). P(a) is just the probability (frequency) of an amino acid, so each column in Mabis divided by the frequency of the corresponding amino acid. The diagonal elements are still all close to 1. • Dayhoff then adjusts the small non-diagonal elements by a common factor that makes the expected number of amino acid substitutions equal to 1 in 100. The diagonal elements are then adjusted to make each row add up to 1 as required by the law of total probability. • This is the PAM1 Markov matrix (PAM = Point Accepted Mutation; 1 = 1% substitution frequency).
Using the PAM Model • The PAM1 Markov matrix can be multiplied by itself to yield the PAM2 Markov matrix, and again to yield the PAM3 matrix, etc. PAM1 is a “unit of evolutionary distance”. • PAM250 is commonly used. Note that 250% of the amino acids have not been substituted – it’s more like 80%. • The PAM Markov Matrices arrived at by matrix multiplication need to be converted into the scoring matrices that one would use for BLAST or CLUSTALW.
Probability of an Alignment In a random model, the probability of the independent alignment of two proteins x and y is the product of the probabilities { qa } for all the amino acids. (Note that the { qi } are not all the same value of 1/20.) In a match model, the proteins have descended from a common ancestor protein and the amino acid sequences are no longer independent. In this model, the probability can be expressed as a matrix of joint probabilities {{ pab }} (Note that the pij = pji because neither protein is “first”.) Dayhoff and coworkers could estimate these probabilities from the frequencies of amino acid substitutions she observed in her database of evolutionarily related proteins.
A Log-Odds Score We are interested in the ratio of the match model probability of alignment to the random model probability: In practice, we usually take the log of these quantities for a substitution “scoring” matrix. This changes the multiplications into additions and reduces round-off error. S(a,b) defines the number you usually see in a substitution matrix. These numbers are usually rounded to integers to ease computation.
Questions? • I will post a Mathematica notebook.