Download

1 / 20
200 likes | 299 Views
Category Depth and Variety. Focus on Demographic Determinants. What makes a “good” category for the semester?. Competition among suppliers for shelf space (not just among brands). Retailer responsibility for brands, facings, depth, and pricing decisions. (No DSD)

E N D
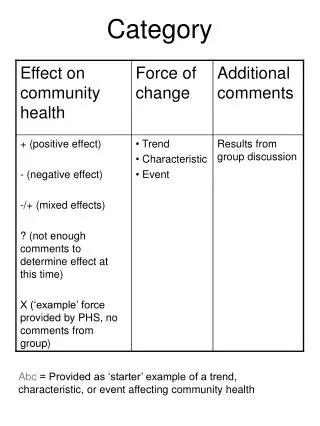
Category Depth and Variety Focus on Demographic Determinants
What makes a “good” category for the semester? • Competition among suppliers for shelf space (not just among brands). • Retailer responsibility for brands, facings, depth, and pricing decisions. (No DSD) • Competition among retailers and retail types (intertype competition, i.e., drug stores, grocery stores, discount stores,…) • It’s “doable” for one person to do one store.
Demographics • Age, income, occupation, education, number of children, marital status, and all combinations thereof. • Census data and Internet web page make it available at no cost to retailers and wholesalers. www.census.gov • How is it used in category management? • How can provide a competitive advantage, to suppliers or retailers?
Suppliers have an initial advantage in product differentiation • Manufacturers must introduce new products. • New brands and extensions are introduced to address the “unseen” motivations of buyers and can segment markets. • Retailers seldom have the scope of resources to introduce products for a particular segment. • Retailers’ locations, and patrons, are their point of differentiation.
The Rising Retailer (?)Corstjens and Corstjens “Retailers must adopt broad, bland positionings: in contrast to manufacturers, retailers cannot deselect important consumer segments. “Shopper segments exist, but they must be targeted within the store. “Retailers must learn to handle in-store data to recognise which of their shoppers of the greatest potential…”
Store-to-store differences within chains • No two locations are identical • Size and orientation of parking lot • Adjacent retailers • Square feet of display area • Entrances • What are the economies of the chain? • Demographics (?)
Buying for the store: • Differentiate from the competitor(s): • Minimize overlapping brands • Carry unique SKUs • Match trade area and/or patrons with the assortment • Understanding of the patrons, and trade area • Knowledge of typical store demographics • Know brand demographics
A.C. Nielsen Homescan “Consumer Facts” • Buyer Behavior and “Purchase Components” • Provides the leading brands, penetration, sales, loyalty, dealing • Allows comparison of category to other categories, relative size, penetration. • Demographic Profile • Shows difference across brands in customer demographic profile
A.C. Nielsen “Tips” • Create a Excel “Workbook” that will compile data for examination independent of access to the Homescan software. • Copy and paste “the Purchase Components” data into a single worksheet. • Copy and paste the Demographic data for “% $ Volume” and “$ Volume Index” into separate worksheets. • Sort on “% $ Volume” for category/brands
Light-duty liquid detergentsTop household demographics: % $ Volume
Identifies “disproportionate” purchasing: Dividing a % $ volume by % of households (multiplying by 100) creates index. “Ivory Liquid, Female Head 55+” = 202 (% $ volume ÷ %household) x 100 =202 56.0% ÷ 27.7% (x100) = 202 Interpreting Index Scores
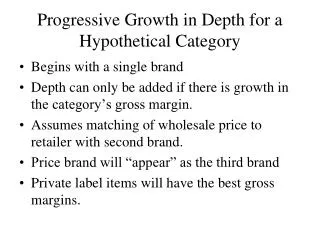
Assigning Selling Space • A category or line’s proportion of selling space can be examined with respect to: • Sales, to overall store sales • Gross margin, to overall gross margins • Physical size of the product and consumer preferences (paper goods) • Inventory needs, unit movement and replenishment costs (soft drinks, DSD product categories) • A line’s space will never be directly proportional to any single characteristic, but evolves to meet the needs of customers’ purchasing patterns and the retailer’s need for gross margins.
Consumer Loyalty • Does the assortment need to carry a certain brand or brands? • What situation is best for the retailer, high flexibility or low flexibility? • Would customers be willing to switch to a higher gross margin, lower priced private label? • What information must be provided to create switching, how could I initiate switching behavior.
Shopping Patterns • Destination items • Purchase frequency • Price sensitivity • Household penetration • Sensitivity, “comfort of environment” • Sales responsiveness to promotions, impulse items
Differentiation or Duplication • Duplicating a competitor’s assortment: • Security in knowing you’re carrying a competitive assortment (“we’re competitive”). • Tap into competitor’s customer base. • Less time required in developing a pricing or assortment strategy • Differentiation • Improved margins • Distinctiveness in the store • Build positive associations with the retailer
Where does the customer shop? • Intertype competition: • Disposable diapers • Pet foods • Batteries • Chewing gum • Bloody Mary mixes • Intratype competition • Distilled spirits (gin, whiskey, vodka) • Prescription drugs