Download
1 / 9
90 likes | 207 Views
Tidal Marsh Condition in the Chesapeake Bay. Presentation for MASC by LRSC’s Wetland Evaluation Taskgroup January 23, 2007. Why We’re Here. 2005 Chesapeake Bay Ecosystem Health report:

E N D
Tidal Marsh Condition in the Chesapeake Bay Presentation for MASC by LRSC’s Wetland Evaluation Taskgroup January 23, 2007
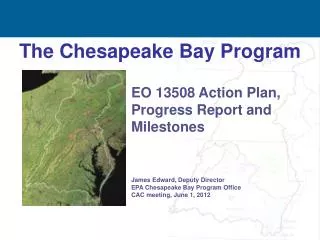
Why We’re Here • 2005 Chesapeake Bay Ecosystem Health report: “Measuring the health and acreage of wetlands throughout the watershed is a difficult and expensive task. Regional scientists are currently developing methods to assess wetland function and track changes in acreage on a watershed level.” • LRSC will propose one option for filling this gap in the 2006 report. • Another option is to submit a request to BSC for funding for analysis of more updated data to allow for a time series comparison
Measuring Tidal Marsh Loss • Difficult due to: • Cost of aerial surveys • Need for skilled analysis (i.e. conversion to open water) • Frequency of updates • Satellite Issues • Weather interference • Simultaneous restoration efforts
Tidal Marsh Loss or Gain • Two primary factors: • Rate of sea level rise • Rate of vertical accretion • If sea level rise outpaces accretion, then marsh deteriorates and is susceptible to loss. • Other factors include storms, shoreline development, water fowl grazing and invasive species.
Proposed Option • “Marsh Condition Index” • Spectral mixing model developed at UMCP • Satellite imagery (Landsat TM) • Change in light reflectance as areas transition from vegetation soil open water • Indicates change in surface condition. Dr. Michael Kearney et al. “Landsat Imagery Shows Decline of Coastal Marshes in Chesapeake and Delaware Bays.” Department of Geography, University of Maryland. 2002.
Processed and peer reviewed data available Bay-wide coverage Multi-year satellite imagery (1988, 1991, 1993, 2001) available and processed Repeatable with funding Spatially-referenced, GIS compatible data Field-validated results 2001 dataset processed but not analyzed Index does not factor in things outside of sea level rise and vertical accretion (i.e. losses to invasive species, shoreline dev.) Index utilizes 1993 data; some acreage has been restored since then. Funding for skilled technician No current funded plan for annual or biannual updates. Marsh Condition Index CONS PROS
Results Marsh Surface Condition Index (MSCI) for selected areas - 1993 TM Data . The Spectral Mixture Model indicates that over 50% of marshes are not healthy in Ches-apeake Bay. Also, lower VA marshes appear to be severely deteriorated.
Healthy Marsh *PROPOSED INDICATOR* DRAFT Percent of Acres in 1993 DRAFT
Water Upland Intact Moderate Severe Thematic Class Change: 1988 - 2001 Results, continued 1988 1993 1999 2001