Download
1 / 1
10 likes | 136 Views
Improving Detection Efficiency of a Space-based Ion Mass Spectrum Analyzer Anne Lamontagne , University of New Hampshire; Mark Popecki , UNH; Lynn Kistler , UNH.

E N D
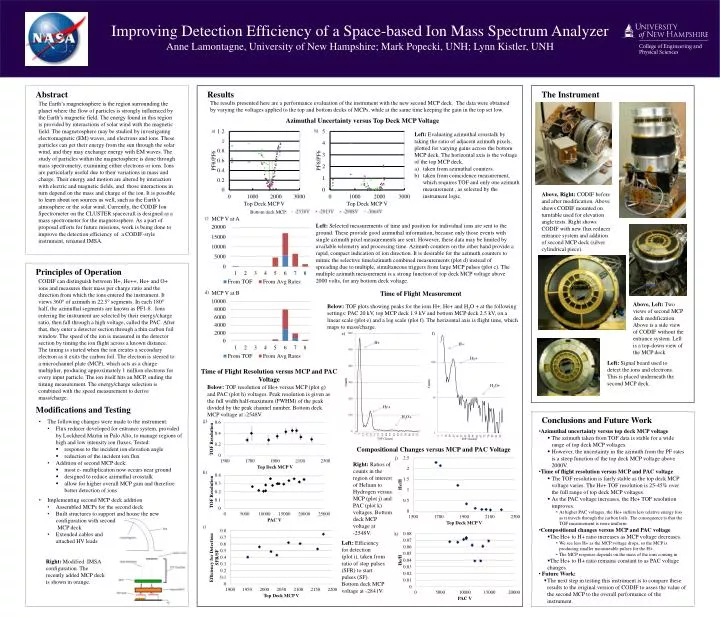
Improving Detection Efficiency of a Space-based Ion Mass Spectrum Analyzer Anne Lamontagne, University of New Hampshire; Mark Popecki, UNH; Lynn Kistler, UNH The Earth’s magnetosphere is the region surrounding the planet where the flow of particles is strongly influenced by the Earth’s magnetic field. The energy found in this region is provided by interactions of solar wind with the magnetic field. The magnetosphere may be studied by investigating electromagnetic (EM) waves, and electrons and ions. These particles can get their energy from the sun through the solar wind, and they may exchange energy with EM waves. The study of particles within the magnetosphere is done through mass spectrometry, examining either electrons or ions. Ions are particularly useful due to their variations in mass and charge. Their energy and motion are altered by interaction with electric and magnetic fields, and those interactions in turn depend on the mass and charge of the ion. It is possible to learn about ion sources as well, such as the Earth’s atmosphere or the solar wind. Currently, the CODIF Ion Spectrometer on the CLUSTER spacecraft is designed as a mass spectrometer for the magnetosphere. As a part of proposal efforts for future missions, work is being done to improve the detection efficiency of a CODIF-style instrument, renamed IMSA. Abstract Results The Instrument • The results presented here are a performance evaluation of the instrument with the new second MCP deck. The data were obtained by varying the voltages applied to the top and bottom decks of MCPs, while at the same time keeping the gain in the top set low. Azimuthal Uncertainty versus Top Deck MCP Voltage a) b) Left: Evaluating azimuthal crosstalk by taking the ratio of adjacent azimuth pixels, plotted for varying gains across the bottom MCP deck. The horizontal axis is the voltage of the top MCP deck. taken from azimuthal counters. taken from coincidence measurement, which requires TOF and only one azimuth measurement , as selected by the instrument logic. B A Above, Right: CODIF before and after modification. Above shows CODIF mounted on turntable used for elevation angle tests. Right shows CODIF with new flux reducer entrance system and addition of second MCP deck (silver cylindrical piece). Bottom deck MCP: c) MCP V at A Left: Selected measurements of time and position for individual ions are sent to the ground. These provide good azimuthal information, because only those events with single azimuth pixel measurements are sent. However, these data may be limited by available telemetry and processing time. Azimuth counters on the other hand provide a rapid, compact indication of ion direction. It is desirable for the azimuth counters to mimic the selective time/azimuth combined measurements (plot d) instead of spreading due to multiple, simultaneous triggers from large MCP pulses (plot c). The multiple azimuth measurement is a strong function of top deck MCP voltage above 2000 volts, for any bottom deck voltage. • CODIF can distinguish between H+, He++, He+ and O+ ions and measures their mass per charge ratio and the direction from which the ions entered the instrument. It views 360° of azimuth in 22.5° segments. In each 180° half, the azimuthal segments are known as PF1-8. Ions entering the instrument are selected by their energy/charge ratio, then fall through a high voltage, called the PAC. After that, they enter a detector section through a thin carbon foil window. The speed of the ion is measured in the detector section by timing the ion flight across a known distance. The timing is started when the ion creates a secondary electron as it exits the carbon foil. The electron is steered to a microchannel plate (MCP), which acts as a charge multiplier, producing approximately 1 million electrons for every input particle. The ion itself hits an MCP, ending the timing measurement. The energy/charge selection is combined with the speed measurement to derive mass/charge. Principles of Operation d) MCP V at B Time of Flight Measurement Above, Left: Two views of second MCP deck modification. Above is a side view of CODIF without the entrance system. Left is a top-down view of the MCP deck Below: TOF plots showing peaks for the ions H+, He+ and H2O + at the following settings: PAC 20 kV, top MCP deck 1.9 kV and bottom MCP deck 2.5 kV, on a linear scale (plot e) and a log scale (plot f). The horizontal axis is flight time, which maps to mass/charge. e) f) H+ H+ He+ Left: Signal board used to detect the ions and electrons. This is placed underneath the second MCP deck. Time of Flight Resolution versus MCP and PAC Voltage H2O+ Below: TOF resolution of He+ versus MCP (plot g) and PAC (plot h) voltages. Peak resolution is given as the full width half-maximum (FWHM) of the peak divided by the peak channel number. Bottom deck MCP voltage at -2548V. He+ Modifications and Testing H2O+ Conclusions and Future Work • The following changes were made to the instrument: g) • Flux reducer developed for entrance system, provided by Lockheed Martin in Palo Alto, to manage regions of high and low intensity ion fluxes. Tested: • response to the incident ion elevation angle • reduction of the incident ion flux • Addition of second MCP deck: • most e- multiplication now occurs near ground • designed to reduce azimuthal crosstalk • allow for higher overall MCP gain and therefore better detection of ions. • Azimuthal uncertainty versus top deck MCP voltage • The azimuth taken from TOF data is stable for a wide range of top deck MCP voltages. • However, the uncertainty in the azimuth from the PF rates is a steep function of the top deck MCP voltage above 2000V. TOF Channel TOF Channel • Compositional Changes versus MCP and PAC Voltage j) Right: Ratios of counts in the region of interest of Helium to Hydrogen versus MCP (plot j) and PAC (plot k) voltages. Bottom deck MCP voltage at -2548V. • Time of flight resolution versus MCP and PAC voltage • The TOF resolution is fairly stable as the top deck MCP voltage varies. The He+ TOF resolution is 25-45% over the full range of top deck MCP voltages. • As the PAC voltage increases, the He+ TOF resolution improves. • At higher PAC voltages, the He+ suffers less relative energy loss as it travels through the carbon foils. The consequence is that the TOF measurement is more uniform. • Compositional changes versus MCP and PAC voltage • The He+ to H+ ratio increases as MCP voltage decreases. • We see less H+ as the MCP voltage drops, so the MCP is producing smaller measureable pulses for the H+. • The MCP response depends on the mass of the ions coming in • The He+ to H+ ratio remains constant to as PAC voltage changes. h) • Implementing second MCP deck addition • Assembled MCPs for the second deck • Built structures to support and house the new configuration with second • MCP deck • Extended cables and • attached HV leads i) k) Left: Efficiency for detection (plot i), taken from ratio of stop pulses (SFR) to start pulses (SF). Bottom deck MCP voltage at -2841V. Right: Modified IMSA configuration. The recently added MCP deck is shown in orange. • Future Work: • The next step in testing this instrument is to compare these results to the original version of CODIF to asses the value of the second MCP to the overall performance of the instrument.