Download

1 / 15
150 likes | 246 Views
Inside Autoplot: an Interface for Representing Scientific Data in Software IN11C-1063. J. B. Faden( 1); R. S. Weigel(2); J. D. Vandegriff(3); R. H. Friedel(4); J. Merka(5, 6)

E N D
Inside Autoplot: an Interface for Representing Scientific Data in SoftwareIN11C-1063
J. B. Faden(1); R. S. Weigel(2); J. D. Vandegriff(3); R. H. Friedel(4); J. Merka(5, 6) 1. Cottage Systems, Iowa City, IA, USA. faden@cottagesystems.com2. George Mason University, Fairfax, VA, USA. 3. JHU/APL, Laurel, MD, USA. 4. LANL, Los Alamos, NM, USA. 5. GEST Center, University of Maryland, Baltimore County, Baltimore, MD, USA. 6. Heliospheric Physics Laboratory, NASA/GSFC, Greenbelt, MD, USA. Abstract Autoplot is software for plotting and manipulating data sets that come from a variety of sources and applications, and a flexible interface for representing data has been developed. QDataSet is the name for the "data model" which has evolved over a decade from previous models implemented by the author. A "data model" is similar to a "metadata model." Whereas a metadata model has terms that describe various aspects of data sets, a data model has terms and conventions for representing data along with conventions for numerical operations. The QDataSet model re-uses several concepts from the netCDF and CDF data models and has novel ideas that extend the reach to include more types of data. Irregular spectrograms and timeseries can be represented, but also new types like events lists, annotations, tuples of data, and N-dimensional bounding boxes. While file formats are central to many models, QDataSet is an interface with a thin syntax layer, and semantics give structure to data. It's been implemented in Java and Python for Autoplot, but can be easily implemented in C, IDL or XML. A survey of other models is presented, as are the fundamental ideas of the interface, along with use cases. Autoplot will be presented as well, to demonstrate how QDataSet and QDataSet operators can be used to accomplish science tasks.
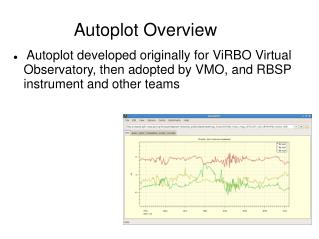
Introduction Autoplot plots data from many different data sources and forms, and represents the data internally using a uniform interface, or “data model” Image from CDF File Vector Time Series from CDF File Scalar Time Series Bz(Time) from ASCII File Image from JPG File Spectral Time Series Flux(Time,En) from CDF file FITS Image SST(Time,Lat,Lon) Qube from NetCDF File Buckshot Z(X(T),Y(T))
Evolution of the Data Model Over the years we’ve had various solutions and experiences representing data in different software systems. (Years indicate active development and don’t imply death dates!) Experience has motivated many of the design and implementation decisions in Autoplot. PaPCo 5 (1996-2000) IDL software Stacks plots from different sources, using plug-in software modules. No data layer, modules render data directly onto the display. Modules can’t talk to each other, and there was lots of duplicated code. Hyd_access (1998-2000) IDL program uses dataset identifiers and time tag representation to return data in IDL arrays. PaPCo module was easily built, along with “scratch pad” module for combining data. This was no real data representation layer, and data like spectrograms never “fit” into the system. Das2 (2002-2006) Java graphics framework uses Java interfaces for representing 1-D time series and spectral data. All data is qualified with a unit object, data atoms are called “Datums.” Specific data types are modeled with specific Java types. Types of data that didn’t conform to these specific types were difficult to represent, such as measurements along a trajectory and vector series. PaPCo 12 (2004-2007) Interface with SDDAS (SwRI) to retrieve data using ad-hoc data representation. We introduced a standard data model, based mostly on CDF conventions. Modules could now provide digital data to one another as service. Autoplot (2006-2009) General-purpose Java plotting tool based on Das2. Quickly found that many types of data didn’t fit into Das2’s specific data model. To plot( [1,2,3,4,5] ), for example, we would have to make up x tags, units, etc. Highly dimensional data like Sea Surface Temperature SST(Time,Lat,Long) didn’t fit at all. We used PaPCo’s model, but convert it to Java interface, and call these “Quick Data Sets” or QDataSets.
Motivation for a Data Model Every software system has some sort of model, explicit or implicit. The way data structures are handled in source code and documentation implicitly defines a data model. Often native array types are sufficient for representing data, but for more complex forms of data, there is a need for an explicit data model. For example, an FFT library uses a 1-D array of interleaved real and imaginary components. Where is the D/C component in the result? Is the result normalized? Interface ambiguity needs to be handled in documentation, requiring human interpretation of an implicit ad-hoc model for each routine. A standard data model increases reuse of software and provides a vocabulary for talking about data. As models for describing metadata are developed, such as SPASE (Space Physics Archive Search and Extract), it’s become clear that models for describing data are valuable as well. The file formats CDF and NetCDF are valuable, but there is a need for a model that is a software interface, not a file format. Waveform and its power spectrum: ds= getDataSet(‘fireworks.wav’) plot( 0, ds ) plot( 1, fftWindow( ds, 256 ) ) An effective data model is: simple, and not burdensome to learn. Capable, and should be able to model commonly used data types. The number of use cases handled is a good measure. Separates syntax from semantics, so that it can be represented in many languages. Uses composition of objects rather than inheritance to develop data types. Should be efficient so that performance doesn’t limit applications. Last, it should provide metadata for data discovery as well as use.
Introduction to Quick Data Sets, Autoplot’s Data Model Quick Data Set (QDataSet) Design Goals: • Provide access to CDF, NetCDF, OpenDAP, SQL, ASCII Tables, and other models with a common interface. • Use a simple Java interface, with implementations that adapt other models, or use Java arrays, Buffers, etc. • Thin syntax layer allows for implementations in Java, Python, IDL, Matlab. • Thin syntax layer allows for formatting to XML and “QStream,” a hybrid XML/ascii (or binary) table format. • Composition of simple datasets in semantics is used to build more complex datasets. • Metadata supports discovery in graphics, for example titles and labels. • Allow for operators such as rebinning, slicing, data reduction, aggregation, autoranging, and histograms. Use in Autoplot: • The main use is data access: plug-in modules provide access to data via QDataSet interface • Data export: plug-in modules format QDataSet to file formats. • QDataSet libraries used for statistics on the data. • Python scripting for combining data. • Data reduction and slicing high rank datasets for display • Caching: data stored to persistent cache using QStream. • Filtering: filters can be applied to data before display. • Access in IDL and Matlab: QStreams are used to move data from Java to IDL, IDL implementation of QDataSet interface provides access to data.
Building a Dataset We can represent very simple things like a scalar or an array. “Rank” is the number of indices needed to access each value. “length” and “value” access the data. Dataset properties are used to develop abstraction through semantics. We create more abstract datasets by linking them together. The DEPEND_0 properties indicates the significance of the 0th index. The property NAME identifies the dataset. For brevity, we omit the values of this rank 2 dataset, and the name/value pairs are properties. Dataset properties can have values of type string, double, boolean, or QDataSet. A list of properties is available at http://autoplot.org/QDataSet.
Autoplot Renderings of Dataset Schemes Other Dataset Schemes scalar time series time range event list spectral time series Note: the above changes in Autoplot 2011! scalar series along trajectory vector time series
The Interface is “Thin” The interface has a “thin” syntax layer, so that it can be represented in many languages: int rank() int length(), length(i), etc double value(), value(i), value(i,j), etc Object property(name), property(name,i), etc For example, the Java representation is an interface with methods supporting rank=0,1,2,3, and 4 datasets. Syntactic representations will reflect limits of each language, but semantics are the same. Rank vs. Dimensionality Note that the number of indexes (rank) doesn’t directly correspond to the number of physical dimensions the dataset occupies (dimensionality.) Dimension Types: DEPEND_i. Indicates the ith index is due to a dependence on another dataset. This increases the dataset dimensionality by one. BUNDLE_i. Indicates the index is used to bundle M datasets together. “unbundle” and “bundle” operators perform do this correctly. The dataset dimensionality is increased by M. BINS_i. A string indicates the index is used to access values that describe data boundaries rather than nominal values. For example, BINS_0=“min,max” means that ds[0] is the bin lower bound and ds[1] is the upper bound. The dataset dimensionality is not increased at all. Example Use Java qds= getDataSet(‘/data.cdf?Bz’); double total=0.0; for ( int i=0; i<qds.length(); i++ ) total+= qds.value(i); DDataSet result= DDataSet.wrap(total) result.putProperty( QDataSet.UNITS, qds.property( QDataSet.UNITS ) ); Python qds= getDataSet(‘/data.cdf?Bz’) total=0.0 for i in xrange(len(qds)): total= total+qds[i] result= wrap( total, UNITS=qds.UNITS ) IDL qds= getDataSet(‘/data.cdf?Bz’) for i=0,n_elements(qds.values)-1 do $ total= total+qds.values[i] result= { values:total, rank:0, $ units: qds.units }
Selected Dataset Properties Dataset properties are based mostly on conventions set by the SPDF at NASA/Goddard. No property is required, unless a data scheme is identified.
Example Operators • slice0(ds,i) extracts the ith dataset of ds. Slicing allows details to be visualized by removing context and reducing dataset rank. DEPEND_0 is sliced, so that the slice location is available in CONTEXT_0 of the result. ds= Flux[Time,Energy,PitchAngle] slice0(ds,0)-> Flux[Energy,PitchAngle ] @ Time[0] • collapse2 reduces data by averaging over a dimension of rank 3 dataset. This is removing the details so that just the context is displayed. collapse2(ds)->Flux[Time,Energy] • transpose. Transpose the indexes of the dataset. • fft. for each rank 1 dataset, perform normalized FFT • fftWindow. partition the rank 1 dataset into rank 2 windows before fft. • smooth. boxcar smooth • diff. return finite differences between adjacent elements • accum. return sum(0..i) for each i. • histogram. tabulates frequency of occurrence of data in specified bins. • autoHistogram. self-adjusting 1-pass histogram useful for data discovery • findex. returns the floating point indices that interleave to datasets • interpolate. 1-D and 2-D interpolation routines The hope is that operators can be written in most any language, and are easily ported to other languages, so that a rich set of operators is developed for the community. Views of a Flux[Time,Energy,PitchAngle] qube. Top panel has data collapsed over pitch angle to make an omnidirectional spectrogram, two panels below are slices at two times.
Use Cases Data ingest for DataShop. DataShop, a Java-based server that provides “unifies” data in standard formats, will use Autoplot’s Data Access libraries to access more types of data. The Java implementation of QDataSet is adapted to DataShop’s internal interface. PaPCo-Autoplot interface. PaPCo will be able to read data via Autoplot’s Data Access libraries, and a serialized version of QDataSet (QStream) is used to communicate data from the Java subprocess into IDL. Autoplot Scripting. Often we wish to process and combine data before plotting. For example, we read data in a rectilinear coordinate system and wish to display it into a polar coordinate system. We define a set of dataset operators that allow these operations to be used with Python scripting. TSDS and Autoplot filtering. We define and interface for filters (such as boxcar average) that take a QDataSet as input and return a QDataSet as output. These filters can be used in the Autoplot client or on the TSDS server. Low-level filters can ignore the metadata allowing scientists to contribute filters without regard for QDataSet conventions, and high-level filters can be built by wrapping low-level filters and minding the metadata. Data Mining. Autoplot provides data to a data mining engine, so that it has sufficient information to make appropriate inferences about the data. Human-generated event lists are handled using the same code. QDataSet-Based Das2 Data Server. Data requests are posted by sending QStream-encoded bounding cubes, data is sent back in QStreams.
Upcoming Work • Create a clean Java implementation of QDataSet, break off as separate project • Identify convention for unit representation • SI Units library integration • Add additional handling for BASIS to support time locations, geo-locations. • Unit-aware arithmetic operators • Identify dataset schemes for Autoplot. • Autoplot can use scheme id to more effectively guess how data should be rendered. • Allow for extension with new schemes and a registry of plug-in dataset render types. • Study operator and QDataSet implementation performance for the Java implementation. • Implementation-specific or “native” slice, trim, and dataset iterators. • Refactor mature and often-used operators for speed at a cost of code size and maintainability. Scheme Identifiers • QDataSet is like XML, it’s a container that lacks strong types. • XML uses schemas or DTDs to constrain type. • QDataSet SCHEME property is similar. • Comma separated list of scheme IDs (multiple inheritance) • Scheme IDs declare inheritance: X>Y>Z (where Z is-a Y, Y is-a X) so that if I know what a Y is, but not a Z, I can still use the scheme ID. • SCHEME=“timeSeries,vector>magneticField” • timeSeries means there will be a DEPEND_0 that points to a dataset with UT time for UNIT, etc. • Scheme IDs would map to specific Java interfaces. Note on Unit handling Units and Basis are used to encode four types of datums into numeric values: • ratio are physical qualities with no BASIS: “Kg” • scale have arbitrary zero: “s since 2000-1-1” • ordinal, as in 1996,1997,etc. Cluster1, Cluster2 • nominal, as in “San Fransisco”, “Chicago”
Conclusions • Authors of data systems should be careful when considering how they will handle data. The data model used, be it implicit or explicit, can be overly simplistic or too constrained, limiting applications and software lifetime. • Data models should separate syntax from semantics, so that they can be expressed in many languages. • Autoplot has to deal with lots of different kinds of data: time series, tables, vector series, correlations. • QDataSet has proven to be lightweight, useful and flexible, and may serve new systems that must handle data. • Autoplot's data access libraries provide access to many forms of data, and one needs be familiar with Quick Data Sets to use it. • QDataSet has a rich set of semantics that allow many forms of data to be represented. • QDataSet source code for Java is available: https://vxoware.svn.sourceforge.net/svnroot/vxoware/autoplot/trunk/QDataSet/ • QDataSet and all of Autoplot is open source under GPL license, see http://www.autoplot.org/ for more information.