Download
1 / 26
260 likes | 368 Views
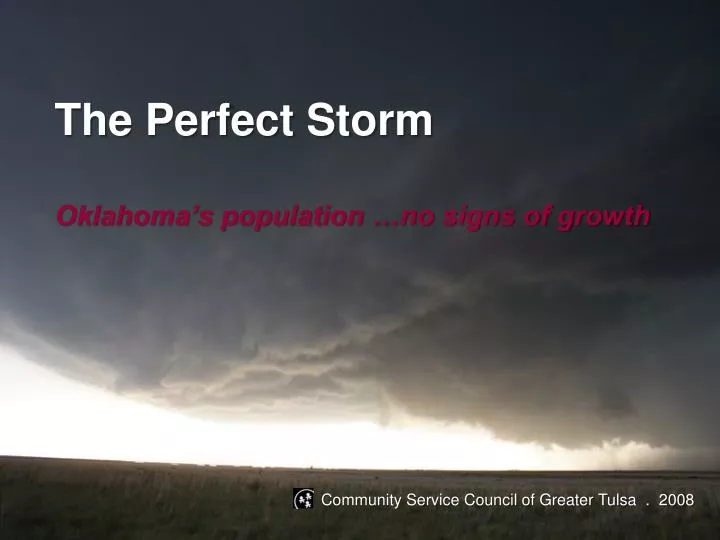
The Perfect Storm Oklahoma’s population …no signs of growth. Community Service Council of Greater Tulsa . 2008.

E N D
The Perfect Storm Oklahoma’s population …no signs of growth Community Service Council of Greater Tulsa . 2008
Eight sources of the Perfect StormLack of mass employment with living wage for unskilled/low-skilled persons, and growing income insecuritiesGrowing workforce shortage Rapid aging of the population Growing challenges to healthy lifestyles and access to quality health care Continued growing immigration Changing environmental conditionsand water insecuritiesUncertainty of future energy supplyGrowing challenges to American culture and identity Community Service Council of Greater Tulsa
Key dimensions of change Demographics Technology Globalization Culture and values Community Service Council of Greater Tulsa
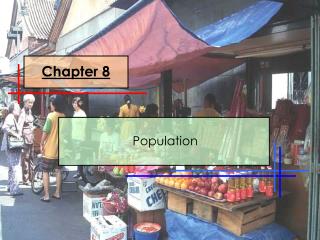
Oklahoma’s Population … No Signs of Growth Community Service Council of Greater Tulsa
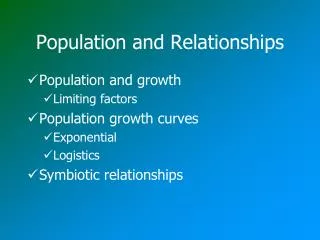
Definitions… Demographic growth: Increase in the size of population by there being more births than death, and more migrants entering than leaving Natural balance: Fundamental growth when there are more births than deaths Size of the population increases when there are more births than deaths and more migrants arriving than departing (migratory balance) Replacement value: Number of children per family just sufficient to keep the total population constant or 2.1 children per woman Community Service Council of Greater Tulsa
Worldwidepopulation growth By 2050 there will be 9 billion people on earth 3 billion will have been added just in the last 46 years Fastest growth is in underdeveloped countries Ethnic and religious diversity will be more important than race U.S. population centers will be coastal Taking a closer look… Community Service Council of Greater Tulsa
Population growth… What about Oklahoma? Community Service Council of Greater Tulsa
Oklahoma is essentially not growing Annual average growth rate between 2000-2006 was 0.6% Without the Hispanic population that would be reduced to 0.3% Average natural growth rate, birth rate minus death rate, was 0.4% Community Service Council of Greater Tulsa
Population declines in Oklahoma are widespread Between 1940-2000, 45 counties lost population for a total of 311,363 people Between 2000-2006, 34 counties lost population The largest losses were in Cimarron (10.8%), Grant (9.3%), and Tillman (8.4%) Counties Community Service Council of Greater Tulsa
Between 2000-2006, 9 more counties would have lost population except for the increases in the Hispanic population…Tulsa County was one Tulsa’s loss would have been 0.7% without the Hispanic population which made it a 0.4% gain Among the 43 counties that increased, 18 increased less than 4% or about 0.6% annually In 2006, 40 counties had a population less than 25,000 …the size of the city of Owasso Community Service Council of Greater Tulsa
62 of Oklahoma’s 77 counties either lost population or grew at a rate less than the state between 1950 and 2005 All but 4 counties had less than 25,000 population in 2005 Community Service Council of Greater Tulsa
Oklahoma’s Population Shifts Only 15 counties grew at or above the state’s growth of 59% All but 6 counties were over 50,000 population in 2005 • Metro Cos. • Cleveland • Rogers • Canadian • Wagoner US Total NE Oklahoma - Delaware - Cherokee OK Total Sequoyah Co. (NE) • Mayes (NE) & • Marshall (SCrtl) Metro Cos. - Tulsa - Oklahoma • Metro Cos. • - McClain • Comanche Metro Cos. - Logan - Creek OK 59% Source: U.S. CENSUS BUREAU Community Service Council of Greater Tulsa
Any growth mainly occurred in Metro Areas The Oklahoma City and Tulsa MSAs share of the state’s growth between 2000-2006 was 89% Oklahoma’s population grew 3.6%; the OKC/Tulsa MSAs grew 5.7% Non-urban areas grew 1.4% Community Service Council of Greater Tulsa
Oklahoma MSAs and Non MSA Population Changes2000-2006 Community Service Council of Greater Tulsa
Oklahoma County & Tulsa County Population Changes2000-2006 Both Oklahoma and Tulsa Counties have been significantly affected by the Hispanic population Without Hispanic population growth, Tulsa County would have had a decline in population Community Service Council of Greater Tulsa
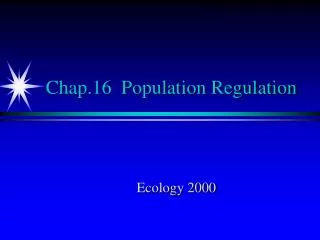
Growth related to natural balance Oklahoma’s natural growth rate has been variable but low 30 counties in Oklahoma had less than 200 births per year Of these, 15 counties had less than 100 births per year Community Service Council of Greater Tulsa
In Tulsa, and in Oklahoma, natural population growth is strongly impacted by fertility rates of Hispanic women Community Service Council of Greater Tulsa
Growth related to natural balance Natural growth is strongly impacted by fertility rates of Hispanic women Community Service Council of Greater Tulsa
Growth related to migration/ immigration Increase in the Hispanic population, including immigrants, is the most critical contributor to population growth in small states Oklahoma’s Hispanic population grew by over 66,000 between 2000-2006 or 37%, an average annual growth of 5.4% The same population grew another 5.5% between 2006-2007 or by almost 14,000 people Community Service Council of Greater Tulsa
Growth related to migration/ immigrationThe non-Hispanic population grew 58,000 or 1.8% between 2000-2006 or less than 0.3% annually The White non-Hispanic population grew by only 19,197 or 0.78%, about 0.1% per year Community Service Council of Greater Tulsa
OklahomaCounty School October 1 Enrollment Change % Change 2000 Race 2006 -14.0 -8,620 52,742 61,362 White NH 3.2 784 25,500 Black 24,716 1,765 31.3 7,404 Native American 5,639 90.0 9,281 Hispanic 10,317 19,598 Tulsa County School October 1 Enrollment Race 2000 2006 Change % Change White NH 65,848 58,731 -7,117 -10.8 Black 17,166 17,563 397 2.3 Native American 10,439 13,467 3,028 29.0 Hispanic 6,088 11,817 5,729 94.0 Community Service Council of Greater Tulsa
Oklahoma’s Population Age Structure Community Service Council of Greater Tulsa
Oklahoma’s total population has grown at just under 0.6% per year People 65 and over increased 5.1% between 2000 and 2007 Total 0-17 18-64 65 & Over 85 & Over Community Service Council of Greater Tulsa
Between 2007 and 2030, Oklahoma’s total population is projected to grow at a slow pace of +10.2% The population of people 65 and over is projected to increase 60% The working age population is projected to decline Total 0-17 18-64 65 & Over 85 & Over Community Service Council of Greater Tulsa
Age Structure: Total Population Percent Change US Compared to Oklahoma by Single Year of Age 0-85+ The age group that is most productive (34-47) is projected to decline Community Service Council of Greater Tulsa
The Perfect Storm …is available on our website: www.csctulsa.org Community Service Council of Greater Tulsa - June 2008 Community Service Council of Greater Tulsa