Download
1 / 14
140 likes | 328 Views
TEXTURE OF NIOBIUM SHEET 3 MM THICKNESS. RF SUPERCONDUCTING MATERIALS WORKSHOP FERMILAB, 23 AND 24 MAY 2007 PETER R. JEPSON PRINCIPAL SCIENTIST H.C. STARCK INC. NEWTON, MA. TEXTURE ANALYSIS BY EBSD. ELECTRON BACK-SCATTERING DIFFRACTION SEM equipped with video camera Channelling

E N D
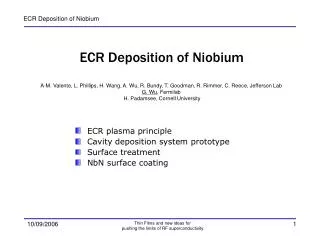
TEXTURE OF NIOBIUM SHEET3 MM THICKNESS RF SUPERCONDUCTING MATERIALS WORKSHOP FERMILAB, 23 AND 24 MAY 2007 PETER R. JEPSON PRINCIPAL SCIENTIST H.C. STARCK INC. NEWTON, MA
TEXTURE ANALYSIS BY EBSD • ELECTRON BACK-SCATTERING DIFFRACTION • SEM equipped with video camera • Channelling • Kikuchi patterns • Yields grain-by-grain information
AREA EXAMINED BY EBSD • Cross-section (through-thickness) reveals more information than planar section • Sample is small, and outside actual part • Full-thickness • Top/bottom symmetry • Step size (square grid): 1/3 average linear intercept • 8 microns • 90 steps horizontally, 375 vertically • 34,000 points at 20 per second: scanning time 30 minutes
COLOUR SCHEMES • Colours are relative to ND, which is vertical in all maps shown 15 DEG 20 DEG 20 DEG ALL EULER TRICOL 15 DEG
HOW BEST TO DESCRIBE TEXTURE QUALITATIVELY • GRAIN MAPS, relative to ND, RD and TD, show • Prominent components (eg. 100 // ND) • Through-thickness gradient • Banding and other inhomogeneities ND ND RD TD
OPTICAL MICROSCOPY PHOTOS FROM FERMILAB TD-06-048
SYMMETRY OF POLE FIGURES 2-FOLD 4-FOLD
QUANTIFICATION OF TEXTURE(FROM GRAIN MAPS) SURFACE • BASED ON HALF-THICKNESS • STRENGTH OF EACH COMPONENT • AREA % WITH <15° MISORIENTATION • THROUGH-THICKNESS GRADIENT • BEST FIT • % PER MM • BANDING FACTOR • AVERAGE RESIDUAL FROM BEST-FIT LINE • % MID-THICK SURFACE MID-THICK
B ND X Z
C ND X Z
SUMMARY • Texture control is important for large-scale production • Repeatable forming • Repeatable response to surface treatments • Maybe also for reliable performance • Texture can be quantified, and therefore specified • Controlled texture (and fine grain) is possible in 3 mm high-RRR Nb sheet.