Download

1 / 11
110 likes | 242 Views
5.1 Organized Counting with Venn Diagrams. What is a Venn diagram? Why do we need it?. It is a technique that is used to organize information. Mathematically it does nothing for us, except to make things clear.

E N D
What is a Venn diagram? Why do we need it? It is a technique that is used to organize information. Mathematically it does nothing for us, except to make things clear.
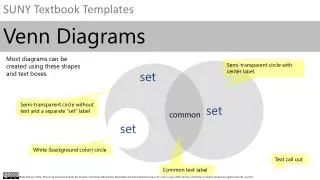
It allows us to analyse situations where there is some overlap among groups of items, or SETS. Circles represent different sets and a rectangular box around the circles represent the UNIVERSAL SET, S, from which all the items are drawn. It is usually labeled with an S in the top left corner. s
The items in the set are called ELEMENTS or MEMBERS of the set. The size of the circles do not have to be proportionate.
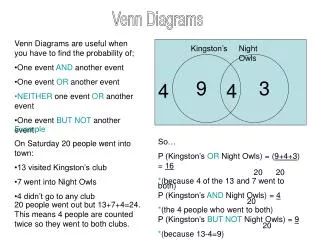
Common elements There are 12 students on a volleyball team and 15 on a basketball team. When planning a game, the coaches noticed that both teams were playing at the same gym. They decided to share a van and needed to know what sized van to get, however the coach could only get a van that sat 19 students. Use a diagram to illustrate this situation.
This illustrates the Principle of Inclusion and exclusion. counting the total of elements in two groups that have a common element, just subtract the common elements so that they are not included twice.
Set A, Set B, total number of elements in A OR B is the number in A plus the number in B minus the number in both A and B. N(A or B) = n(A) + n(B) – n(A and B) The set of elements in A OR B is the UNION A U B The set of elements in A AND B is the INTERSECTION A upside down B
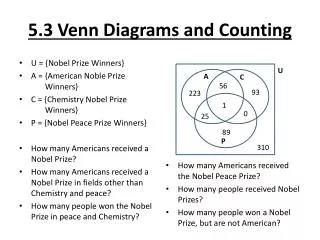
Example. There are 52 students signed up for biology, 71 for chemistry, 40 for physics. The science students include 15 taking both biology and chemistry, 8 taking chemistry and physics, 11 taking biology and physics, and 2 who take all three science courses. How many students are not taking any of these three science courses? Illustrate with a Venn Diagram.
N(total) = n(B) + n(C) + n(P) – n(B and C) – n(C and P) – n(B and P) + n(B and C and P) Make sure to subtract the number of students who have been counted twice, but you have to add back those that were subtracted twice since they were in all three classes. = 52 + 71 + 40 – 15 – 8 – 11 + 2 = 131
Draw the Venn Diagram Start with overlap of three courses. Consider adjacent regions representing students taking two of three courses Then find the remaining total for each circle.
Homework Pg 270 # 2, 3, 4, 5, try 6