Download
1 / 11
110 likes | 115 Views
Learn about the Susitna-Watana Hydro project, a sustainable hydropower solution that would reduce CO2 emissions and provide clean energy. Explore its economic impact, funding options, and key considerations.

E N D
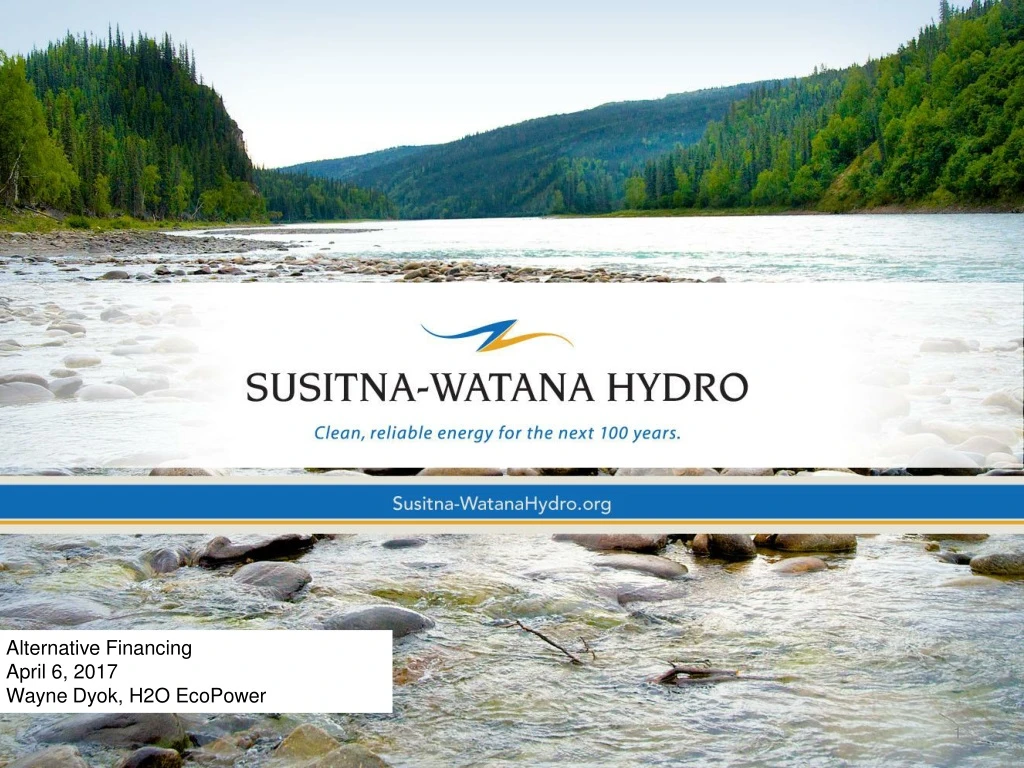
Alternative Financing April 6, 2017 Wayne Dyok, H2O EcoPower
Hydropower: Providing Clean Energy • Susitna-Watana Hydro would displace an estimated 1.3 million tons of CO2 annually That equals the annual emissions from 231,246 cars, or more than half of all registered passenger vehicles in the state. Car emissions source EPA
Project Highlights • Susitna-River Mile 184 • 87 River Miles from Talkeetna • 22-32 River Miles upstream from Devils Canyon • 42-mile reservoir, average width of one mile • ~50 percent of Railbelt’s Energy Demand (2.8 GWH of annual energy) • Dam Height: 705 Feet • Estimated Cost: $5.6 Billion
Project Funding • Funded total of $192 million through Capital Fund appropriations • FY09-11: $11.17 million (combination of Railbelt Energy Fund and General Fund) • FY12: $65.7 million (Railbelt Energy Fund) • FY13: $0 • FY14: $95.2 million (General Fund) • FY15: $20 million (General Fund)
Economic Impact • Study conducted by Northern Economics • $11.2 billion in energy savings during first 50 years (2014$) • 2.39 cost benefit ratio based on energy savings • 3.07 cost benefit ratio based on new capacity, generation facility retirement, greenhouse gas reductions and power outage reduction • 1,300 average annual jobs during construction • 205 pre-construction and non-construction jobs on an annual basis (2010-2028) • $800 million in local pre-construction spending • $2.6 billion in local construction spending
Economic Benefits • Direct jobs: • 5,000 preconstruction and non-construction direct jobs (2010-2028) • 12,000 direct overall construction workforce • Local spending and statewide multiplier effects:
Comparing 3 Finance Options • Bond & RUS Financing • “Donut Hole” is financed with AEA Revenue Bonds (30 years, 5% interest, refinanced) • RUS financing remainder of construction (35 years, 4% interest) • $0.066/kWh 50 year average real price • All Bond Financing • All construction financed with AEA Revenue Bonds (30 years, 5% interest, refinanced) • $0.083/kWh 50 year average real price • State Loan & RUS • “Donut Hole” is financed with State loans (30 year repayment beginning after RUS is paid off, 0% interest) • RUS financing remainder of construction (35 years, 4% interest) • Similar to Bradley Lake model • $0.041/kWh 50 year average real price
P3 CONSIDERATIONS • FERC License • Land Ownership • Memorandum of Understanding re Power Purchase Agreements • State of Alaska Approvals • Construction Schedule