Download
1 / 36
410 likes | 502 Views
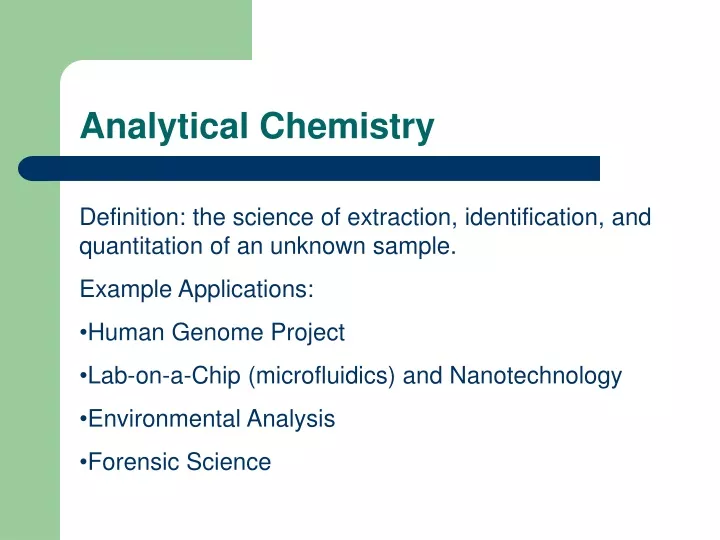
Analytical Chemistry. Definition: the science of extraction, identification, and quantitation of an unknown sample. Example Applications: Human Genome Project Lab-on-a-Chip (microfluidics) and Nanotechnology Environmental Analysis Forensic Science. Course Philosophy.

E N D
Analytical Chemistry Definition: the science of extraction, identification, and quantitation of an unknown sample. Example Applications: • Human Genome Project • Lab-on-a-Chip (microfluidics) and Nanotechnology • Environmental Analysis • Forensic Science
Course Philosophy • develop good lab habits and technique • background in classical “wet chemical” methods (titrations, gravimetric analysis, electrochemical techniques) • Quantitation using instrumentation (UV-Vis, AAS, GC)
Analyses you will perform • Basic statistical exercises • %purity of an acidic sample • %purity of iron ore • %Cl in seawater • Water hardness determination • UV-Vis: Amount of caffeine and sodium benzoate in a soft drink • AAS: %Cu in pre- and post-1982 pennies • GC: Gas phase quantitation using an internal standard titrations
Example, p. 19: Molarity of Salts in the Sea • Calculate molarity of 2.7 g NaCl/dL • [MgCl2] = 0.054 M. How many grams in 25 mL?
Dilution Equation Concentrated HCl is 12.1 M. How many milliliters should be diluted to 500 mL to make 0.100 M HCl? M1V1 = M2V2 (12.1 M)(x mL) = (0.100 M)(500 mL) x = 4.13 M
Chapter 3:Math Toolkit accuracy = closeness to the true or accepted value (given by the AVERAGE) precision = reproducibility of the measurement (given by the STANDARD DEVIATION)
Significant Figures • Digits in a measurement which are known with certainty, plus a last digit which is estimated beaker graduated cylinder buret
Rules for Determining How Many Significant Figures There are in a Number • All nonzero digits are significant (4.006, 12.012, 10.070) • Interior zeros are significant (4.006, 12.012, 10.070) • Trailing zeros FOLLOWING a decimal point are significant (10.070) • Trailing zeros PRECEEDING an assumed decimal point may or may not be significant • Leading zeros are not significant. They simply locate the decimal point (0.00002)
ans = 63.5 Reporting the Correct # of Sig Fig’s • Multiplication/Division 12.154 5.23 36462 24308 60770 Rule: Round off to the fewest number of sig figs originally present 63.56542
Reporting the Correct # of Sig Fig’s • Addition/Subtraction 15.02 9,986.0 3.518 10004.538 Rule: Round off to the least certain decimal place
Reporting the Correct # of Sig Fig’s • Addition/Subtraction in Scientific Notation Express all of the numbers with the same exponent first: 1.632 x 10⁵+ 4.107 x 10³+ 0.984 x 10⁶
Reporting the Correct # of Sig Fig’s • Logs and anti-logs
Rounding Off Rules • digit to be dropped > 5, round UP158.7 = 159 • digit to be dropped < 5, round DOWN158.4 = 158 • digit to be dropped = 5, make answer EVEN158.5 = 158.0 157.5 = 158.0 • BUT 158.501 = 159.000
? sig figs 5 sig figs 3 sig figs 1.235-1.02 0.215 = 0.22 Wait until the END of a calculation in order to avoid a “rounding error” (1.235 - 1.02) x 15.239 = 2.923438 = 1.12
Propagation of Errors A way to keep track of the error in a calculation based on the errors of the variables used in the calculation error in variable x1 = e1 = "standard deviation" (see Ch 4) e.g. 43.27 0.12 mL percent relative error = %e1 = e1*100 x1 e.g. 0.12*100/43.27 = 0.28%
Addition & Subtraction Suppose you're adding three volumes together and you want to know what the total error (et) is: 43.27 0.12 42.98 0.22 43.06 0.15 129.31 et
Gaussian Distribution: Fig 4.2
Mean – measure of the central tendency or average of the data (accuracy) N Infinite population Finite population Standard Deviation – measure of the spread of the data (reproducibility) Infinite population Finite population
Confidence Interval of the Mean The range that the true mean lies within at a given confidence interval True mean “” lies within this range x
Example - Calculating Confidence Intervals • In replicate analyses, the carbohydrate content of a glycoprotein is found to be 12.6, 11.9, 13.0, 12.7, and 12.5 g of carbohydrate per 100 g of protein. Find the 95% confidence interval of the mean. ave = 12.55, std dev = 0.465 N = 5, t = 2.776 (N-1) = 12.55 ± (0.465)(2.776)/sqrt(5) = 12.55 ± 0.58
Rejection of Data - the Grubbs Test A way to statistically reject an “outlier” Compare to Gcrit from a table at a given confidence interval. Reject if Gexp > Gcrit
Sidney: 10.2, 10.8, 11.6 Cheryl: 9.9, 9.4, 7.8 Tien: 10.0, 9.2, 11.3 Dick: 9.5, 10.6, 11.3
Linear Least Squares (Excel’s “Trendline”)- finding the best fit to a straight line