Download
1 / 35
350 likes | 416 Views
Mesoclimate near the Tapajós-Amazon confluence David R. Fitzjarrald (1) , Ricardo K. Sakai (1) , Osvaldo M. M. Moraes (2) , Otávio C. Acevedo (2) , Matthew J. Czikowsky (1) Jungle Research Group Atmospheric Sciences Research Center, University at Albany, SUNY, NY, USA

E N D
Mesoclimate near the Tapajós-Amazon confluence • David R. Fitzjarrald(1), Ricardo K. Sakai(1), Osvaldo M. M. Moraes(2), • Otávio C. Acevedo(2), Matthew J. Czikowsky(1) • Jungle Research Group • Atmospheric Sciences Research Center, University at Albany, SUNY, NY, USA • Universidade Federal de Santa Maria, RS, Brazil
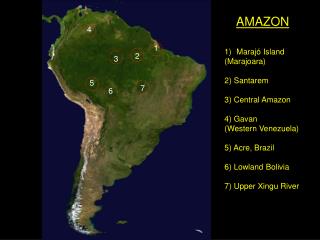
LBA research sites LBA-ECO Santarém
Pbelem DPBelStm T U SOI Prec
E W Fujita’s transmission factors; wind roses
The ‘river of air’ moves into the basin day and night. A CBL over the river is 200-300 m thick. Implications for the ultimate fate of CO2 emitted from river.
Radiative fluxes at the km67 site PARdn Kdn Ldn Lup Q*
Appreciably more global solar radiation near the river… Clocks are OK! Diurnal asymmetry in mean Kdn results from similar asymmetry in cloudiness.
Max Mean Min Wet season
Max Mean Min Dry season
Precipitation Connect the dots to get the rivers
Diurnal patterns of precipitation depend on proximity to river STM weather stations CMORPH, Kousky et al. 2006
18-21 UTC 00-03 UTC 12-15 UTC 06-09 UTC 06-09 UTC 12-15 UTC 00-03 UTC 18-21 UTC Influence of large scale ‘mega squall lines’ on precipitation Time of ‘maximum precipitation rate’ (From Kousky et al. 2006, CMORPH analyses)
convective synoptic Rain Dial (UT) Afternoon precipitation from local convective activity
River breeze important near the river (where the climate stations are) Radiative flux bias at climate stations along river can be +30% Precipitation bias can be -20% to -30% Be careful how much you believe the gridded precipitation data. (Always ask how remote sensing products have been ‘ground-truthed’.) Interesting nocturnal CBL over river may have implications for the recycling of CO2 emitted from the water.


![Dynamo: Amazon’s Highly Available Key-value Store Giuseppe DeCandia et al. [Amazon]](https://cdn0.slideserve.com/164014/dynamo-amazon-s-highly-available-key-value-store-giuseppe-decandia-et-al-amazon-com-dt.jpg)