Download
1 / 34
340 likes | 433 Views
Visualizing Software Architectures, Part 2. Software Architecture Lecture 12. Objectives. Concepts What is visualization? Differences between modeling and visualization What kinds of visualizations do we use? Visualizations and views How can we characterize and evaluate visualizations?

E N D
Visualizing Software Architectures, Part 2 Software ArchitectureLecture 12
Objectives • Concepts • What is visualization? • Differences between modeling and visualization • What kinds of visualizations do we use? • Visualizations and views • How can we characterize and evaluate visualizations? • Examples • Concrete examples of a diverse array of visualizations • Constructing visualizations • Guidelines for constructing new visualizations • Pitfalls to avoid when constructing new visualizations • Coordinating visualizations
UML Visualizations • Canonical graphical depictions + tool-specific interactions • XMI: Textual depiction in XML + text-editor interactions • Advantages • Canonical graphical depiction common across tools • Graphical visualizations have similar UI metaphors to PowerPoint-style editors, but with UML semantics • XMI projection provides textual alternative • Disadvantages • No standard for interaction as there is for depiction • In some tools hard to tell where UML model ends and auxiliary models begin • Most UML visualizations are restricted to (slight variants) of the canonical UML depiction
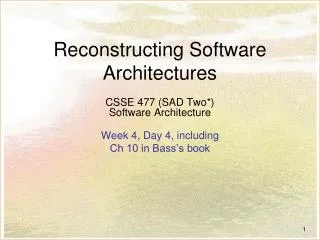
UML Visualization Software Architecture: Foundations, Theory, and Practice; Richard N. Taylor, Nenad Medvidovic, and Eric M. Dashofy; (C) 2008 John Wiley & Sons, Inc. Reprinted with permission.
UML Visualization <UML:Class xmi.id = '723' name = 'Data Store' visibility = 'public' isSpecification = 'false' isRoot = 'false' isLeaf = 'false' isAbstract = 'false' isActive = 'false'/> <UML:Association xmi.id = '725' name = '' isSpecification = 'false' isRoot = 'false' isLeaf = 'false' isAbstract = 'false'> <UML:Association.connection> <UML:AssociationEnd xmi.id = '726' visibility = 'public' isSpecification = 'false' isNavigable = 'true' ordering = 'unordered' aggregation = 'none' targetScope = 'instance' changeability = 'changeable'> <UML:AssociationEnd.multiplicity> <UML:Multiplicity xmi.id = '727'> <UML:Multiplicity.range> <UML:MultiplicityRange xmi.id = '728' lower = '1' upper = '1'/> ... Software Architecture: Foundations, Theory, and Practice; Richard N. Taylor, Nenad Medvidovic, and Eric M. Dashofy; (C) 2008 John Wiley & Sons, Inc. Reprinted with permission.
Scope/Purpose Visualization of UML models Basic Type Graphical (diagrams), textual (XMI) Depiction Diagrams in UML symbolic vocabulary/XML-formatted text Interaction Depends on the editor; generally point-and-click for diagrams; text editor for XMI Fidelity Diagrams are canonical, XMI elides layout info Consistency Generally good across diagrams; small exceptions Comprehensibility Ubiquity assists interpretations Dynamism Rare View coordination Some editors better than others Aesthetics Simple symbols reduce complexity; uniform diagrams Extensibility Profile support OK; major language extensions hard UML Visualizations: Evaluation
Rapidé • Rapidé models are generally written with a canonical textual visualization • Some graphical builders available as well • Focus: Interesting effect visualization of simulation results • Advantages • Provides an intuitive way to visualize the causal relationships between events • Automatically generated from Rapide specifications • Disadvantages • Complex applications generate complex graphs • Difficult to identify why particular causal relationships exist • Simulation is not interactive
Rapidé Examples type DataStore is interface action in SetValues(); out NotifyNewValues(); behavior begin SetValues => NotifyNewValues();; end DataStore; type Calculation is interface action in SetBurnRate(); out DoSetValues(); behavior action CalcNewState(); begin SetBurnRate => CalcNewState(); DoSetValues();; end Calculation; type Player is interface action out DoSetBurnRate(); in NotifyNewValues(); behavior TurnsRemaining : var integer := 1; action UpdateStatusDisplay(); action Done(); Software Architecture: Foundations, Theory, and Practice; Richard N. Taylor, Nenad Medvidovic, and Eric M. Dashofy; (C) 2008 John Wiley & Sons, Inc. Reprinted with permission.
Scope/Purpose Graphical event traces Basic Type Graphical Depiction Directed acyclic graph of events Interaction No substantial interaction with generated event traces Fidelity Each trace is an instance; different simulation runs may produce different traces in a non-deterministic system Consistency Tiny symbol vocabulary ensures consistency Comprehensibility Easy to see causal relationships but difficult to understand why they’re there Dynamism No support View coordination Event traces are generated automatically from architectural models Aesthetics Simple unadorned directed acyclic graph of nodes and edges Extensibility Tool set is effectively a ‘black box” Rapidé Effect Visualization: Evaluation
Labeled Transition State Analyzer (LTSA) • A tool for analyzing and simultaneously visualizing concurrent systems’ behavior using a modeling language called FSP • Advantages • Provides multiple concurrent visualizations of concurrent behavior • Integrates both model and effect visualizations, textual and graphical depictions • Can develop domain-specific visualizations to understand abstract models • Disadvantages • Behavior specification language has somewhat steep learning curve • Developing domain-specific graphical visualizations can be expensive
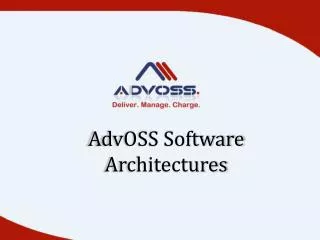
LTSA Examples Software Architecture: Foundations, Theory, and Practice; Richard N. Taylor, Nenad Medvidovic, and Eric M. Dashofy; (C) 2008 John Wiley & Sons, Inc. Reprinted with permission.
LTSA Examples Software Architecture: Foundations, Theory, and Practice; Richard N. Taylor, Nenad Medvidovic, and Eric M. Dashofy; (C) 2008 John Wiley & Sons, Inc. Reprinted with permission.
Scope/Purpose Multiple coordinated visualizations of concurrent systems’ behavior Basic Type Textual, Graphical, Effect Depiction Text & state machines for models, various effect viz. Interaction FSP can be edited textually or graphically Fidelity Graphical visualizations may elide some information Consistency Limited vocabulary helps ensure consistency Comprehensibility FSP has some learning curve; domain-specific effect visualizations are innovative Dynamism Animation on state-transition diagrams and domain-specific visualizations View coordination Views are coordinated automatically Aesthetics State transition diagrams are traditional; domain-specific visualizations can enhance aesthetics Extensibility New domain-specific effect visualizations as plug-ins LTSA: Evaluation
xADL Visualizations • Coordinated set of textual, graphical, and effect visualizations for an extensible ADL • Advantages • Provides an example of how to construct a wide variety of (often) coordinated or interrelated visualizations • Lets users move fluidly from one visualization to another • Guidance available for extending visualizations or adding new ones • Disadvantages • Some learning curve to extend graphical editors • Adding or extending visualizations has to be done carefully so they play well with existing ones
xADL Visualization Examples <types:component xsi:type="types:Component" types:id="myComp"> <types:description xsi:type="instance:Description"> MyComponent </types:description> <types:interface xsi:type="types:Interface" types:id="iface1"> <types:description xsi:type="instance:Description"> Interface1 </types:description> <types:direction xsi:type="instance:Direction"> inout </types:direction> </types:interface> </types:component> Software Architecture: Foundations, Theory, and Practice; Richard N. Taylor, Nenad Medvidovic, and Eric M. Dashofy; (C) 2008 John Wiley & Sons, Inc. Reprinted with permission.
xADL Visualization Examples <types:component xsi:type="types:Component" types:id="myComp"> <types:description xsi:type="instance:Description"> MyComponent </types:description> <types:interface xsi:type="types:Interface" types:id="iface1"> <types:description xsi:type="instance:Description"> Interface1 </types:description> <types:direction xsi:type="instance:Direction"> inout </types:direction> </types:interface> </types:component> component{ id = "myComp"; description = "MyComponent"; interface{ id = "iface1"; description = "Interface1"; direction = "inout"; } } Software Architecture: Foundations, Theory, and Practice; Richard N. Taylor, Nenad Medvidovic, and Eric M. Dashofy; (C) 2008 John Wiley & Sons, Inc. Reprinted with permission.
xADL Visualization Examples <types:component xsi:type="types:Component" types:id="myComp"> <types:description xsi:type="instance:Description"> MyComponent </types:description> <types:interface xsi:type="types:Interface" types:id="iface1"> <types:description xsi:type="instance:Description"> Interface1 </types:description> <types:direction xsi:type="instance:Direction"> inout </types:direction> </types:interface> </types:component> component{ id = "myComp"; description = "MyComponent"; interface{ id = "iface1"; description = "Interface1"; direction = "inout"; } } Software Architecture: Foundations, Theory, and Practice; Richard N. Taylor, Nenad Medvidovic, and Eric M. Dashofy; (C) 2008 John Wiley & Sons, Inc. Reprinted with permission.
xADL Visualization Examples <types:component xsi:type="types:Component" types:id="myComp"> <types:description xsi:type="instance:Description"> MyComponent </types:description> <types:interface xsi:type="types:Interface" types:id="iface1"> <types:description xsi:type="instance:Description"> Interface1 </types:description> <types:direction xsi:type="instance:Direction"> inout </types:direction> </types:interface> </types:component> component{ id = "myComp"; description = "MyComponent"; interface{ id = "iface1"; description = "Interface1"; direction = "inout"; } } Software Architecture: Foundations, Theory, and Practice; Richard N. Taylor, Nenad Medvidovic, and Eric M. Dashofy; (C) 2008 John Wiley & Sons, Inc. Reprinted with permission.
xADL Visualization Examples <types:component xsi:type="types:Component" types:id="myComp"> <types:description xsi:type="instance:Description"> MyComponent </types:description> <types:interface xsi:type="types:Interface" types:id="iface1"> <types:description xsi:type="instance:Description"> Interface1 </types:description> <types:direction xsi:type="instance:Direction"> inout </types:direction> </types:interface> </types:component> component{ id = "myComp"; description = "MyComponent"; interface{ id = "iface1"; description = "Interface1"; direction = "inout"; } } Software Architecture: Foundations, Theory, and Practice; Richard N. Taylor, Nenad Medvidovic, and Eric M. Dashofy; (C) 2008 John Wiley & Sons, Inc. Reprinted with permission.
Scope/Purpose Multiple coordinated visualizations of xADL models Basic Type Textual, Graphical, Effect Depiction XML, abbreviated XML, symbol graphs, hybrid effect (MTAT) Interaction Visualizations emulate various editing paradigms Fidelity Textual & ArchEdit complete; graphical leave detail out Consistency Effort to follow conventions Comprehensibility Varies; some easier than others Dynamism Animation on state-transition diagrams and domain-specific visualizations View coordination Many views coordinated ‘live,’ MTAT leverages some animation Aesthetics Varies; Archipelago promotes aesthetic improvements by allowing fine customization Extensibility Many extensibility mechanisms at different levels xADL Visualizations: Evaluation
Objectives • Concepts • What is visualization? • Differences between modeling and visualization • What kinds of visualizations do we use? • Visualizations and views • How can we characterize and evaluate visualizations? • Examples • Concrete examples of a diverse array of visualizations • Constructing visualizations • Guidelines for constructing new visualizations • Pitfalls to avoid when constructing new visualizations • Coordinating visualizations
Constructing New Visualizations • Developing a new visualization can be expensive both in initial development and maintenance • Must answer many questions in advance • Can I achieve my goals by extending an existing visualization? • Can I translate into another notation and use a visualization already available there? • How will my visualization augment the existing set of visualizations for this notation? • How will my visualization coordinate with other visualizations? • (Plus all the evaluation categories we’ve been exploring)
New Visualizations: Guidelines • Borrow elements from similar visualizations • Leverages existing stakeholder knowledge • Improves comprehensibility • Be consistent among visualizations • Don’t conflict with existing visualizations without a good reason (e.g., developing a domain-specific visualization where the concepts and metaphors are completely different) • Give meaning to each visual aspect of elements • Parsimony is more important than aesthetics • Corollary: avoid having non-explicit meaning encoded in visualizations
New Visualizations: Guidelines (cont’d) • Document the meaning of visualizations • Visualizations are rarely self-explanatory • Focus on mapping between model and visualization • Balance traditional and innovative interfaces • Stakeholders bring a lot of interaction experience to the table • But just because a mechanism is popular doesn’t mean it’s ideal
New Visualizations: Anti-Guidelines • Same Symbol, Different Meaning Software Architecture: Foundations, Theory, and Practice; Richard N. Taylor, Nenad Medvidovic, and Eric M. Dashofy; (C) 2008 John Wiley & Sons, Inc. Reprinted with permission.
New Visualizations: Anti-Guidelines (cont’d) • Differences without meaning Software Architecture: Foundations, Theory, and Practice; Richard N. Taylor, Nenad Medvidovic, and Eric M. Dashofy; (C) 2008 John Wiley & Sons, Inc. Reprinted with permission.
New Visualizations: Anti-Guidelines (cont’d) • Decorations without meaning Software Architecture: Foundations, Theory, and Practice; Richard N. Taylor, Nenad Medvidovic, and Eric M. Dashofy; (C) 2008 John Wiley & Sons, Inc. Reprinted with permission.
New Visualizations: Anti-Guidelines (cont’d) • Borrowed symbol, different meaning Software Architecture: Foundations, Theory, and Practice; Richard N. Taylor, Nenad Medvidovic, and Eric M. Dashofy; (C) 2008 John Wiley & Sons, Inc. Reprinted with permission.
Coordinating Multiple Visualizations • How do we keep multiple simultaneous visualizations of the same (part of the) architectural model consistent with each other and the model? • This is NOT the same as maintaining architectural consistency • If something is wrong with the model, this error would be reflected in the visualizations • Can be made much easier by making simplifying assumptions, e.g.: • Only one visualization may operate at a time • Only one tool can operate on the model at a time • But what if we can’t simplify like this?
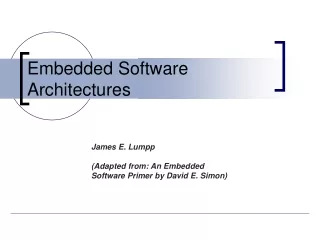
Strategy: Peer-to-Peer Coordination • Each visualization communicates with each other visualization for updates • Has scaling problems • Works best for visualizations known a priori Software Architecture: Foundations, Theory, and Practice; Richard N. Taylor, Nenad Medvidovic, and Eric M. Dashofy; (C) 2008 John Wiley & Sons, Inc. Reprinted with permission.
Strategy: Master-Slave • One visualization is the master and others coordinate through it • Works best when visualizations are subordinate • E.g., a “thumbnail” or “overview” next to a main, zoomed-in visualization Software Architecture: Foundations, Theory, and Practice; Richard N. Taylor, Nenad Medvidovic, and Eric M. Dashofy; (C) 2008 John Wiley & Sons, Inc. Reprinted with permission.
Strategy: Pull-based • Visualizations repeatedly poll a model repository for changes • Potential consistency/staleness problems • May be necessary if model repository is entirely passive • May save computing power Software Architecture: Foundations, Theory, and Practice; Richard N. Taylor, Nenad Medvidovic, and Eric M. Dashofy; (C) 2008 John Wiley & Sons, Inc. Reprinted with permission.
Strategy: Push-based • Visualizations actively notified and update themselves whenever model changes for any reason • Best for multiple simultaneous visualizations • Hard to debug, must avoid infinite loops and subtle concurrency conditions Software Architecture: Foundations, Theory, and Practice; Richard N. Taylor, Nenad Medvidovic, and Eric M. Dashofy; (C) 2008 John Wiley & Sons, Inc. Reprinted with permission.
Caveats • Like the modeling lectures, this optimized for breadth rather than depth • You are encouraged to explore these in depth, as well as visualizations you encounter in your own experiences • Although we can attempt to conceptually separate modeling notations and visualizations, they are never truly distinct • Each influences the other in direct and indirect ways