Download
1 / 6
60 likes | 150 Views
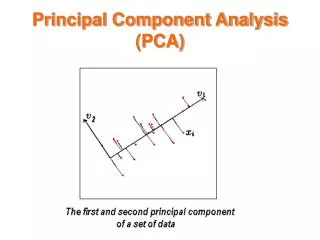
Principal Components Analysis (PCA). PCA Goals. Given N “experiments” each determining a set of values for M data variables, where M is large Find The “best” set of L variables, L < M, that describe this data

E N D
Principal Components Analysis (PCA) University of Texas at Austin CS395T - Advanced Image Synthesis Spring 2007 Don Fussell
PCA Goals • Given • N “experiments” each determining a set of values for M data variables, where M is large • Find • The “best” set of L variables, L < M, that describe this data • “Best” means the new variables will be the L dimensions of greatest data variance, in order • Thus, we reduce the dimensionality of the data, retaining the most important information about how the data varies and throwing away the rest. This is a kind of compression, but clearly not the only kind (see e.g. DCT) University of Texas at Austin CS395T - Advanced Image Synthesis Spring 2007 Don Fussell
Overview of Method • Given mxn input matrix X (recall n observations of each of m variables) • Calculate the empirical mean a • Create a matrix of deviations from the mean (B) by subtracting a from X • Find the covariance matrix C of B • Find the eigenvector matrix E and the eigenvalue diagonal matrix D of C • Sort the columns of E and D in decreasing eigenvalue order • Pick the first L columns of (sorted) E to make the l xn matrix K • Create output matrix Y = KTB (note: really adjoint, not transpose, in general) University of Texas at Austin CS395T - Advanced Image Synthesis Spring 2007 Don Fussell
Detailed Steps - mean centering • Often just assumed wlg in descriptions of this method • Compute the average of each row • Subtract the averages from each data element University of Texas at Austin CS395T - Advanced Image Synthesis Spring 2007 Don Fussell
Detailed steps - covariance • Compute • Covariance • Measure of independence of pairs of variables • If independent then University of Texas at Austin CS395T - Advanced Image Synthesis Spring 2007 Don Fussell
Detailed steps - eigendecomposition • Compute matrix E of eigenvectors and D of eigenvalues s.t. • See spectral theorem of linear algebra • This is widely available in math packages University of Texas at Austin CS395T - Advanced Image Synthesis Spring 2007 Don Fussell