Download
1 / 35
350 likes | 378 Views
This presentation explores the measurement of bone quality beyond DXA, including imaging techniques such as CT and MRI, as well as invasive methods. It discusses the importance of bone density and quality in determining bone strength and evaluates different tools for measuring bone quality such as hip structural analysis and trabecular bone score.

E N D
Fracture Prediction Tools Beyond DXA BMDISCD Annual MeetingFebruary 28, 2015 Susan Broy MD FACP FACR CCD Professor of Clinical Medicine Rosalind Franklin School of Medicine, Chicago Medical School
Disclosures No disclosures to report
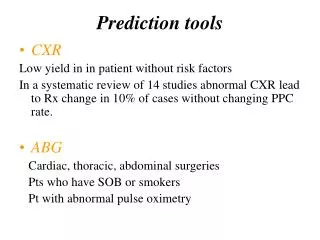
OUTLINE • Introduction – what is bone strength? • Bone density • Bone quality • Measuring bone “quality” • Invasive • Imaging • CT and MRI, including finite element analysis (FEA) • DXA • Hip structural analysis (HSA) • Trabecular bone score (TBS)
What Is Osteoporosis? “A skeletal disorder characterized by compromised bone strength predisposing to an increased risk of fracture.” “Bone strength is a composite of bone density and bone quality” Healthy bone NIH Consensus Development Panel JAMA 2001;285:785
Bone Strength • Bone “quality” • Matrix properties • Damage accumulation • Collagen quality • Mineralization (eg. crystal size) • Macroarchitecture • Bone size • Bone shape • Microarchitecture • Bone density • Explains 60-80% of bone strength in cadaveric studies1,2 1Cheng XG et al. J Bone Miner Res 1997;12:1721-8 2Bousson V et al. Osteoporos Int 2006;17:855-64
Can We Measure Bone Quality? • Invasive • Mechanical studies of cadaveric bone = direct measurement of bone strength • Bone biopsy – tetracycline labeled • Bone metabolism and structure Important in research but not clinically useful
Can We Measure Bone Quality? • Invasive • Imaging by CT/MRI • HR-pQCT, µMRI: microarchitecture • QCT: • 3-D geometry • Finite element analysis (FEA) • Imaging by DXA • HSA – hip structural analysis • Measures size and shape of femur i.e. macroarchitecture • TBS – trabecular bone score • Evaluates microarchitecture of vertebrae Research Dr Engelke
Importance of Macroarchitecture:Larger Bones Are Stronger Bones Cylinder B has less bone but the same strength as cylinder A A larger bone (e.g. in a man) is a stronger bone than a smaller bone with the same volumetric density1 1Bruno AG et al. J Bone Miner Res 2014;29(3):562-569
CSA and Femoral Neck Width Changes With Age CSA does not decrease as much as BMD because of an increase in femoral neck width Source: NHANES III courtesy Dr. Anne Looker, National Center for Health Statistics, CDC Images courtesy of Tom Beck
Section modulus Inner and Outer Bone Diameters expand with age Density Simplistic Geometry 20 40 60 80 100 Age Slide courtesy of Dr Thomas Beck
Bending Axial Compression Stress Distributions in Cross-sections Axial Compression Uniform across bone surface, proportional to cross-surface area (CSA) Bending Non-uniform across bone surface. Maximal at outer surfaces. Quantified by section modulus (SM)
Change in Femoral Neck BMD and Section Modulus With Age (NHANES III) Females Males Aging leads to decreased BMD but periosteal expansion helps preserve section modulus, especially in males Beck TJ et al, J Bone Miner Res 2000;15:2297
Hip Geometry Measurements • CSA: cross-sectional area • CSMI: cross-sectional moment of inertia • SM: section modulus • BR: buckling ratio • OD: outer diameter • HAL: hip axis length • NSA: neck-shaft angle Software programs HSA™ (Hologic) AHA™ (GE)
Measuring Geometric Parameters by DXA Profile and Cross-section have equal: Line of pixels defines a cut plane through the bone OD Outer diameter CSA CSMI, Sm BR = Sm/length Mass projected in cut plane describes bone cross-section
Narrow Neck Intertrochanteric Shaft Bone Geometry Using 2-Dimensional DXAHip Structural Analysis • Mineral profiles are extracted from DXA images by software and used to estimate geometric properties. • BMD, outer diameter, CSA and CSMI measured from profiles • Sm and BR calculated • Requires assumptions about bone shape and distribution of cortical and trabecular bone at each site. Image courtesy of Thomas J. Beck, ScD..
Hologic Report OD: Subperiosteal width CSA: cross-sectional area CSMI: cross-sectional moment of inertia Z = section modulus CT: cortical thickness BR: buckling ratio HAL : Hip axis length greater trochanter to inner pelvic rim NSA: neck-shaft angle (NSA)
GE-Lunar Report Outer diameter Neck-shaft angle d1, d2: measurements of femoral neck length d3 = outer diameter y: measurement of radius at minimum CSMI alpha: angle femoral shaft to vertical theta: neck-shaft angle Strength index (SI) = estimated strength/ expected stress Yoshikawa T et al J Bone Miner Res 1994; 9:1053-64 Faulkner KG et al Osteoporos Int 2006;17:593-9
What is the Evidence? • Multiple studies have shown that hip geometry parameters are associated with risk of hip fracture • Hip geometry parameters (especially Sm, BR, HAL and NSA) are associated with hip fracture in postmenopausal women1,2 • NSA is associated with hip fracture in men and women3 • Measurements change with condition or treatment • Aging4 • Exercise5 • Pharmacologic therapy: estrogen, raloxifene, alendronate, denosumab, teriparatide 1Kaptoge S et al. J Bone Miner Res 2008;23:1892 4Beck TJ et al J Bone Miner Res 2000;15;:297 2Leslie WD et al. Osteoporos Int 2009;20:1767 5Hind K et al. Bone 2007;40:14-27 3Faulkner KG et al. Osteoporos Int 2006;17:593
Effects of Alendronateand Risedronate on Hip Geometry (FACT Extension Study) Alendronate 70 mg once weekly for 2 years Risedronate 35 mg once weekly for 2 years ALN RIS ALN RIS ALN RIS ALN RIS † † † † † † † † † † † † † † † † † † † Buckling Ratio † † † * Mean Change From Baseline, % BMD CSA Section Modulus Cortical Thickness – – † † * P<0.05. †P<0.005. ALN = alendronate. RIS = risedronate. CSA = cross-sectional area. † – † ALN RIS – Reproduced from Bonnick SI et al. Poster presented at the 28th Annual Meeting of the American Society for Bone and Mineral Research; September 16, 2006; Philadelphia, PA. Poster SA345.
Is Measurement of Hip Geometry Ready For Prime-Time? • Pros • FDA-approved software • HSA™ • AHA ™ • Can do at same time as DXA • Evidence correlates with fracture risk in women • Cons • Variable precision – depends on image quality, positioning • Except for HAL, not clear if fracture risk is independent of BMD • Need universally accepted standards for use • Need cut-off points • Can geometric measurements be incorporated into FRAX calculations? ISCD Position Development Conference addressing these issues
Bone Strength • Bone “quality” • Matrix properties • Damage accumulation • Collagen quality • Mineralization (eg. crystal size) • Macroarchitecture • Bone size • Bone shape • Microarchitecture • Bone density • Explains 60-80% of bone strength in cadaveric studies* *Cheng XG et al. J Bone Miner Res 1997;12:1721-8 Bousson V et al. Osteoporos Int 2006;17:855-64
Relevance of Microarchitectureto Structural Strength Normal Loss of Loss of Quantity and Quantity Architecture Architecture Loss BMD No change in BMD
Microarchitectural Changes in Osteoporosis Normal Osteoporotic Horizontal Disconnections Dempster 2000
Evaluating Microarchitecture • Bone biopsy • HR-pQCT • Micro-MRI • TBS Research
TBS: Trabecular Bone Score • Textural index: DXA software that extracts bone texture information from a regular AP spine DXA scan image • Gray-level variations in the image provide an indirect assessment of microarchitecture • Has been shown to be related to bone microarchitecture and fracture risk • Provides information independent of BMD
Trabecular Bone Score (TBS)Principles Well-structured trabecular bone Experimental variogram of pixel gray-levels Degraded trabecular bone DXA image Pothuaud et al.Bone 2008;42:775-87 Hans et al. JCD 2011;14:302-12 Winzenrieth et al. JCD 2013; 16:287-96
Principles of TBSMeasures variability of pixel gray-levels TBS = 1.459 Large variability, small amplitude BMD=0.972 Low variability, high amplitude BMD=0.969 TBS = 1.243 Silva BC at al. J Bone Miner Res 2014;29(3):518-30
Sample TBS Report Normative database for USA: Simonelli C et al. J Clin Densitom 2014
What is the Evidence? • Many studies • 61 entries for TBS in PubMed (November 2014) • 1 ASBMR abstract in 2011, 19 in 2012, 33 in 2013, 22 in 2014 • Correlates with mechanical behavior of cadaveric vertebrae1 • Correlates with microarchitectural parameters • Cadaveric vertebrae 1,2 • In vivo µCT3 • Predicts fracture3 1Roux JP et al. Osteoporos Int 2013;24(9):2455-60 2 Hans D et al. J Clin Densitom 2011;14(3):302-12 3Silva BC at al. J Bone Miner Res 2014;29(3):518-30
What Is The Evidence?TBS Predicts Fracture Cross-sectional studies Prospective studies* Pothaud ‘09 Winzenreith ‘10 Rabier ‘10 Krueger’13 Lamy’12 Del Rio ‘13 Pothaud ‘09 Krueger ‘13 Lamy ‘12 Manitoba ’11 JPOS ‘13 OPUS ’13 Manitoba ‘11 Manitoba ‘11 OFELY ’13 OPUS * F/U 4.7 – 8years Silva BC at al. J Bone Miner Res 2014;29(3):518-30
BMD Plus TBS Predicts Fracture Better Than Either Alone • Manitoba, Canada • N=29,407 women >50 • Mean F/U 4.7 years • 1668 major osteoporotic • fractures (MOF)* *MOF = spine, hip, humerus or radius Hans D et al. J Bone Miner Res 2011;26:2762-9
Could TBS be Helpful in 2° Osteoporosis?Why Do Type 2 Diabetics Fracture At Higher BMD? HR-pQCT Distal Tibia Postmenopausal Women Control Diabetic with fracture Link TM Skeletal Radiol 2010;39:943-55
TBS Predicts Fracture Risk in Diabetics Diabetics Have Higher BMD but Lower TBS Odds ratios (95% CI bars) for BMD or TBS measurement in the lowest vs highest tertile according to presence of diabetes. TBS predicted fracture in thosewithdiabetes as well as thosewithoutdiabetes. Leslie WD et al. J Clin Endocrinol Metab 2013;98:602-9
Is TBS Ready For Prime-Time? • Pros • FDA-approved in 2012 • Can do at same time as DXA • EvidenceTBS correlates with • Mechanical strength • Microarchitectural parameters • Fracture risk (cross-sectional and prospective studies) • Provides information independent of BMD • Might be helpful in cases of secondary osteoporosis • Type 2 diabetes1 • Cons • No reimbursement • Need universally accepted standards for use • Need cut-off points • Can TBS be incorporated into FRAX calculations?2 • German osteoplogy society (DVO) 2014 guidelines include a TBS offset for FRAX calculations ISCD PDC addressing these issues 1Leslie WD et al. J Clin Endocrinol Metab 2013;98:602-9 2Johannson H et al. IOF meeting 2013 Hong Kong
Summary • Bone strength includes bone density and bone “quality” • Bone “quality” can be assessed by • Invasive: mechanical studies of cadaveric bone, bone biopsy • Research: HR-pQCT, µMRI (microarchitecture), 3-D QCT (macroarchitecture) • Possible clinical use: • FEA • HSA (geometry i.e. macroarchitexture) • TBS (microarchitecture) ISCD Position Development Conference Will review the evidence and develop official positions on the clinical utility of non DXA BMD measures of fracture risk