Download
1 / 24
240 likes | 414 Views
Update on the Southern Ocean source/sink for atmospheric CO 2. Andrew Watson 1 Nicolas Metzl 2. 1 University of East Anglia, Norwich 2 LOCEAN-IPSL, CNRS, Universit é Pierre et Marie Curie, Paris. Southampton, June 15 2010. With thanks to many people:

E N D
Update on the Southern Ocean source/sink for atmospheric CO2. Andrew Watson1 Nicolas Metzl2 1University of East Anglia, Norwich 2LOCEAN-IPSL, CNRS, Université Pierre et Marie Curie, Paris Southampton, June 15 2010
With thanks to many people: Dorothee Bakker, Pete Brown, Andrew Lenton, Corinne Le Quéré, Ute Schuster, Taro Takahashi, and many others
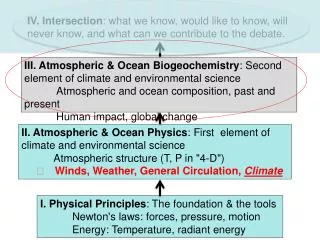
Outline • Do we expect the Southern Ocean to be a source or sink of CO2 to/from the atmosphere? • Takahashi et al., Southern Ocean in the context of the global ocean CO2 sink. • Is the sink increasing or staying constant?
Do we expect the SO to be a source or sink of CO2 to the atmosphere? The Polar Southern Ocean is the region where NADW returns to the surface. The NA takes atmospheric CO2 into the interior as it sinks -- expect it to outgas when it returns -- More generally, upwelling regions are sources, downwellling regions are sinks
Do we expect the SO to be a source or sink of CO2 to the atmosphere? • For “natural” (pre-industrial) carbon cycle it is a source • But for “anthropogenic” carbon – the perturbation due to increasing CO2, it is a strong sink – because the surface water is rapidly ventilated. • The decomposition into pre-industrial and anthropogenic is only valid so long as the circulation does not change
Southern ocean and recent observational estimates of the global sink
Takahashi et al global synthesis of measured CO2 fluxes 2002 (above ) and 2009 (below) 2009 Globally integrated, is 1.4 GtC /yr , compared to 2002 (2.2 GtC/yr) Major differences are mostly due to southern Ocean – estimates of winter time surface CO2
Takahashi et al 2009 • Difference in pCO2 values used for later vs earlier study (a) February (b) August
Sea-air CO2 flux anomalies Recent trends in the Southern Ocean sink Le Quere et al: Models suggest that, as atmospheric CO2 increases, the Southern Ocean should become an increasing sink. Atmospheric CO2 data and ocean models forced with re-analysis fluxes suggest a flattening out of of the total Southern Ocean carbon sink since 1980. Changes associated with increasing SAM, wind speed across the Southern Ocean Le Quéré et al., Science, 2007
Problem 1: Law et al: suggest the atmospheric inversion is not robust, and the ocean uptake is strongly dependent on uncertain atmospheric forcing fields.
Problem #2: Böning et al find no evidence for recent, decadal change in slope of isopycnals across the ACC
Amsterdam MINERVE (1991-1995) and OISO (1998-2007) Original painting, C.Verdier What do in-situ observations of pCO2, fluxes say? Exploring fCO2 trends from observations: Use long time series in the South-western Indian ocean
Trend atmosphere: + 1.7 µatm/yr Trend ocean: + 2.1 µatm/yr Ocean sink decreases ? : -0.4 µatm/yr (OISO Cruises) All data in SOCAT and CDIAC Metzl, DSR, 2009
Cruises: 1991-1995 (MINERVE) and 1998-2007 (OISO) Process analysis: exploring fCO2 trends in four selected regions and only for summer/winter: Metzl, DSR 2009
Austral summer and winter ocean fCO2 trends (µatm/yr) in four regions in the South-Western Indian Ocean Average: 2.1 (+0.3) µatm/yr Almost always above the atmospheric CO2 rate (the sink decreases ???) Metzl, DSR 2009
Average: 2.1 (+0.3) µatm/yr Temperature Normalized fCO2 2.6 (+1.2) µatm/yr Contrasting results in winter, north and south of 40°S Link with SAM ? More DIC ? Less DIC ? Decreasing ΔfCO2, increasing winds near-constant flux Metzl, DSR 2009
Decadal pCO2 trends (winter data > 50°S, SST ranges) Takahashi et al., DSR 2009 A « circumpolar» view Trend ocean CO2: + 2.1 (0.6) µatm/yr …… Same as, South-Indian: +2.1 µatm/yr But few data in 1980-1992
Climate Change in the Southern Ocean The Southern Annular Mode (~ Patm 40S-60S observed) High Low Source Marshall
O3 clim: ocean CO2 sink increases, Ocean pCO2: +1.1 uatm/yr O3 hole: ocean CO2 sink stabilized Ocean pCO2: +2.0 µatm/yr Air-sea CO2 fluxes in the Southern Ocean Results from a coupled climate/carbon model (IPSL/LOOP with and without O3 hole) (Lenton et al, GRL, 2009)
Conclusions • Pre-industrially, the SO is a source of CO2 to the atmosphere • Today, it is (probably) a weak sink • Except in a few well-studied regions (e.g. S. Indian Ocean) we don’t have the data to answer this question by observation • Need winter time observations • Controversy over whether this sink is increasing in time, or is constant. If increased SAM increased upwelling, it should be nearly constant. • Such observations as there are suggest approx constant.
Observations Another view of the pCO2 decadal Variations in the Southern Ocean (1970-2007: > 3 Mdata) Takahashi et al (2009, DSR SOCOVV)