Download
1 / 20
200 likes | 275 Views
Water Power Peer Review. Belinda A. Batten. Oregon State University belinda.batten@oregonstate.edu , 541.737.9492 2 November 2011. Oregon State University & University of Washington. Northwest National Marine Renewable Energy Center. Purpose, Objectives, & Integration.

E N D
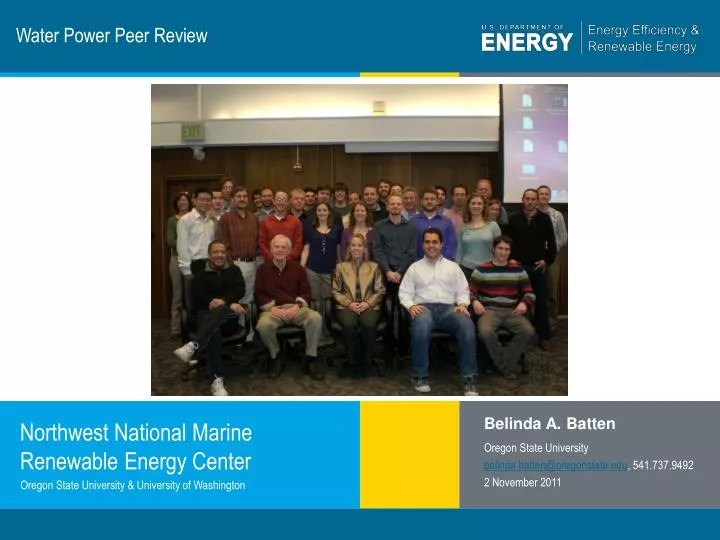
Water Power Peer Review Belinda A. Batten Oregon State University belinda.batten@oregonstate.edu, 541.737.9492 2 November 2011 Oregon State University & University of Washington Northwest National Marine Renewable Energy Center
Purpose, Objectives, & Integration NNMREC’s mission is to facilitate the commercialization of marine energy technology, inform regulatory and policy decisions, and to close key gaps in scientific understanding with a focus on student growth and development. NNMREC’s Project Objectives: • Develop facilities to serve as integrated test Center for wave & tidal energy developers • Evaluate potential environmental and ecosystem impacts • Optimize devices and arrays for deployment • Improve forecasting • Increase reliability and survivability
Purpose, Objectives, & Integration Internal Program Integration: • Monthly PI videoconferences • Annual meetings • Bi-weekly marine forums • Websites for information dissemination External Program Integration includes partnerships with: • Industry • National Labs • Other universities • Standards committees
Technical Approach Field Studies Numerical Modeling Laboratory/Scale Model Tests At-Sea Test Facility
Technical Approach Environmental Sediment Transport Marine Mammals Benthic Ecosystems EMF and Acoustics Site Characterization Social Fisheries/Crabbing Outreach/Engagement Existing Ocean Users Local/Oregon Economy Technical Testing/Demonstration Wave Forecasting Survivability/Reliability Advanced Materials Device/Array Optimization
Plan, Schedule, & Budget Schedule • Initiation date: 15 September 2008 (contracted March 2009) • Planned completion date: 14 March 2014 • Milestones: Year 2/3 has 25 milestones • On target with 21 • 4 delayed related to “Integrated and Standardized Test Facility”; delays in design and environmental clearance • Anticipate contract for test berth build in next 2 months; then on-track with milestones by mid 2012 • Go/no-go meeting 6 December 2011 for Phase III Funding (15 March 2012 – 14 March 2014) Budget: • As of 11 July 2011, 68% of the federal share and 47% of cost match spent in 78% of time on contract • Expenditures roughly 50-50 federal and cost match(see below). • Cost match expenditures increase substantially once test berth is complete (approximately March 2012)
Accomplishments and Results Develop Facilities to Serve as Integrated Test Center for Wave & Tidal Energy Developers • Completed pre-design and feasibility study for 1MW floating mobile ocean test berth (MOTB) vs. cable-to-shore approach; • Developed a phased ocean wave test facility development plan – Newport Site open for testing in 2012; Concept development for cabled ocean tidal test facility; • Worked with NREL on testing protocol and instrumentation development processes; • Tested two different wave technologies in OSU scaled test facilities in the current funding period; and • Prototyped Sea Spider instrumentation package: 31,000 hours deployment – no instrumentation lost
Accomplishments and Results Evaluate Potential Environmental and Ecosystem Impacts • Developed initial nearshore wave and current model for WEC array sites; • Developed estimates of nearshore wave field deviations due to test berth induced perturbations; • Open ocean test facility environmental characterization • Convened workshop on environmental effects for tidal energy development • Developed physically-based models of an open-ocean/estuary tidal system incorporating tidal energy extraction.
Accomplishments and Results Optimize Devices and Arrays for Development • Developed reference model in Matlab/simulink for OPT-type device for hydrodynamics and power take-off; • Modeled array effects for tidal devices; modeled WEC array validated by tank testing • Developed fully nonlinear fluid-structure interaction code for near field and for intermediate field; and • Developed vertical axis turbine as prototyping & teaching tool
Accomplishments and Results Improve Forecasting – Wave Energy • Only wind forecasts used to predict wave conditions • Bottom friction and wind effects are minimal on OR shelf • Forecast error for wave height ~10-15% • Daily 84-hour forecasts for OR coast now coming online: NANOOS web page H (m) 2.5 months
Accomplishments and Results Improve “Forecasting” – Tidal Energy 50 m Methodology Development Methodology Implementation Instrumentation Deployments: April ‘09-Present
Accomplishments and Results Improve “Forecasting” – Tidal Energy Standards 50 m Methodology Development Methodology Implementation Siting Data for Snohomish PUD Instrumentation Deployments: April ‘09-Present
Accomplishments and Results Reliability and Survivability Composite Aging Test Foul Release Test (Hempel SA) Significant loss of stiffness and strength may occur in less than 12 months No biofouling after 9 months deployment
Challenges to Date Final 1x1 nm site Lack of validation data for laboratory/numerical studies due to delay of pilot projects • Develop at-sea test facilities to generate validation data • Partner with regulatory agencies and industry Limited resources to support development of at-sea test facilities • Pursue complimentary funding for first US grid connected test berth site (both wave & tidal) • Develop phased open ocean testing facility plans for wave energy converters Yaquina Head NEPA study area Newport, Oregon Territorial Sea (3nm) Yaquina Bay 14
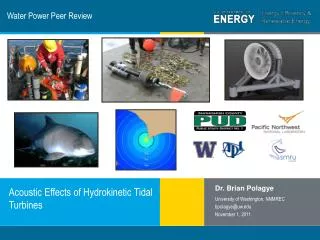
Next Steps Tidal Energy: NNMREC Phase 3 Pursue research enabling short-term and long-term cost of energy reductions for tidal energy • Design conditions: quantification of turbulence, protocols to calculate design loads • Device spacing: empirical rules for device spacing based on experimental/field validation of numerical simulations • Acoustic effects: field characterization of turbine noise, validated methodology for pre-installation estimation of acoustic effects • Extractable resource: protocols for implementing tidal power extraction in regional numerical models • Compliant moorings: dynamic and control considerations for deep-water moorings
Next Steps Wave Energy: NNMREC Phase 3 Continue research efforts advancing industry toward commercialization • Test site Development: Newport site open 2012; feasibility study for grid connected site; site selection • Characterize impact of WEC deployment: environmental (ecological & physical) effects research enabled by devices in water • Device, Array & PTO modeling: Develop analysis tools for design of WEC devices/arrays; numerical code development with validation • Control of devices and arrays: further work in life extending control, array operation • Industry support: protocols development, scaled wave tank and open ocean testing, standards development
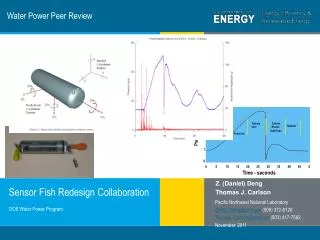
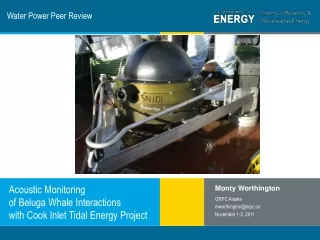
Accomplishments and Results Tidal Energy: Enabling Data-Driven Investigation SS #02 and #03 (August 2010) Acoustic Effects Study DOE FOA w/ Snohomish PUD SS #01 (April 2009) Proof of Concept Core NNMREC SS #05 and #06 (May 2011) Active Sonar Evaluation BOEMRE/NOAA/DOE NOPP 31,500 deployment hours – no lost instrumentation
Accomplishments and Results Tidal Energy: Array Optimization and Spacing Critical driver for cost of energy Wake Evolution Constant vorticity contours around two turbines Cross-sectional Variation
Accomplishments and Results Tidal Energy: Extractable Resource Modeling Challenge Energy removal effects govern the upper limit for resource assessment, but are difficult to model Technical Approach Idealized model of estuarine – fjord – open ocean system with energy extraction Salinity and velocity in idealized estuary