Download
1 / 13
130 likes | 231 Views
19970629/00Z. 19970627/00Z. 19970627/12Z. 19970628/12Z. SLP rising (TC weakening). ETC intensifying. A Technique to predict the outcome of extratropical transition. E. A. Ritchie 1 , J.S. Tyo 1 , and O. Demirci 2 1 University of Arizona 2 University of New Mexico.

E N D
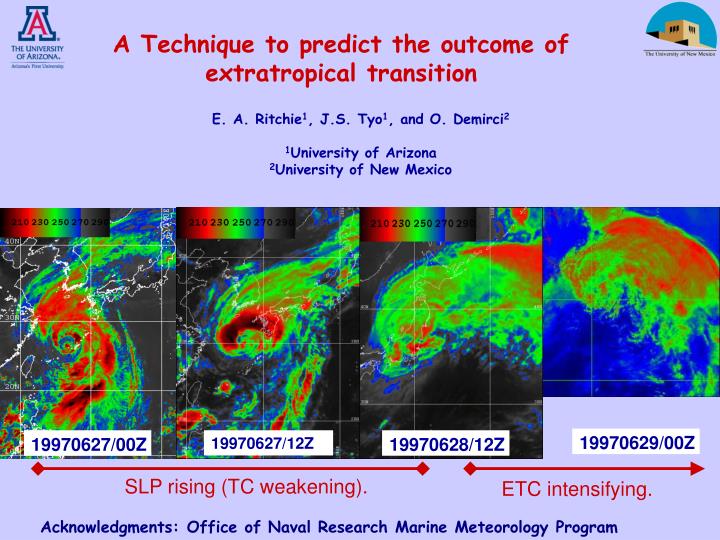
19970629/00Z 19970627/00Z 19970627/12Z 19970628/12Z SLP rising (TC weakening). ETC intensifying. A Technique to predict the outcome of extratropical transition E. A. Ritchie1, J.S. Tyo1, and O. Demirci2 1University of Arizona 2University of New Mexico Acknowledgments: Office of Naval Research Marine Meteorology Program
Objective – develop a simple technique that adds value to the NWP forecasts during ET Method:- ET is a very “visual” problem - use statistical pattern-recognition techniques Initial attempt:- objectively distinguish ahead of time those TCs that will intensify from those that will dissipate during ET.
36 h into S2 During S1 End of S1 Peter 1997 (+) Ivan 1997 (-) ET + 00
- Data - NOGAPS analyses interpolated to a 61o long. x 51o lat. grid of 1o resolution centered on the TC location - TC location from JTWC best track data or from minimum sea-level pressure determined from NOGAPS analyses. • - Training Data - 70 ET Storms from 1997 – 2003 western N-Pacific • - Test Data – 27 ET Storms from 2004 - 2005
Training set - 70 cases of ET of 3000–D data at 9 different times from 1997 – 2003 1. Run eigenanalysis at each time 70 EOFs and PCs each TC has a unique set of PCs represent TCs by their PCs 51 pts 61 pts 2. The higher-order EOFs contain “noise” not relevant to our problem -> results in over-fitting of the data a) retain largest 20 PCs (~98% of variance) b) optimize over highest 20 PCs to get “most important” 10 PCs of these 20. -> removes high-order information (over-fitting) -> improves the robustness of the system.
û0 PC1 PC2 û0 PC1 PC2 3. Find a unit vector, û0, that maximises the separation (d’) of the two populations in 10-PC space. û0= ai + bj + ck + dl + …
Now we can plot the probability distribution of the training data against the projection distance to û0 And the corresponding Receiver Operating Characteristic (ROC) curve PF = 1 - TN . (TN+FP) PD = TP . (TP+FN)
û0 PC1 PC2 End Images What is the technique actually “seeing” to do its prediction?
Dissipating Cases Intensifying Cases Height 700 mb Wind 200 mb Potential Temp 850 mb
Multivariable – incorporate two variables at a single into the training set using EEOF, SVD analysis or a technique we call “3D-space” to replace the EOF analysis step
Results for Temperature and Divergence using EEOF Divergence
Results for Temperature and Divergence using SVD Divergence
Conclusions and Future Work System is “simple” – provides a yes or no decision – adds confidence to a NWP forecast. • Incorporating multiple variables generally improves performance (measured by increased detection for same false-alarm rate). • Increase the Training Set substantially • - improve utility by increasing the number of classes discriminated:- Strong, Moderate, Weak intensifiers, dissipators • Fast, Moderate, Slow intensifiers • Early, Delayed intensifiers • - better representation of any individual storm • - better representation of seasonal and interannual cycles in the training set • (Reanalysis data or use model to “create” training set • Move away from model dependence by using remote-sensed data that discriminate the two classes • – e.g., surface winds, precipitation estimates.