Download
1 / 28
340 likes | 771 Views
10 Years of Successes and Experiences with SAP at PSEG . Stephen Roche Public Service Enterprise Group. PSEG – Corporate Overview. Public Service Enterprise Group is a publicly traded energy and energy services company: PSEG Energy Holding PSEG Power PSEG Services Corporation

E N D
10 Years of Successes and Experiences with SAP at PSEG Stephen Roche Public Service Enterprise Group
PSEG – Corporate Overview • Public Service Enterprise Group is a publicly traded energy and energy services company: • PSEG Energy Holding • PSEG Power • PSEG Services Corporation • PSE&G (Public Service Electric and Gas) • Total assets: $28.9- billion • Total revenues: $12.2 billion • Ranked 178 on Fortune 500 • Ranked 249 on Forbes 400 Best Big Companies • Employs nearly 10,000 people – 98% in New Jersey
PSEG – Corporate Overview Traditional T&D Regional Wholesale Energy Domestic/Int’l Energy Leveraged Leases 2008E Operating Earnings: $1,420M - $1,560M Assets (as of 9/30/07): $28.9B Market Capitalization (as of 2/6/08): $23.6B
PSEG Operating Companies • Public Service Enterprise Group (PSEG)is a publicly traded (NYSE:PEG), growing energy and energy services • company headquartered in New Jersey. Its main subsidiaries are: PSEG Power LLC, Public Service Electric and Gas • Company (PSE&G) and PSEG Energy Holdings LLC • Total assets: $29.8 billion • Total revenues: $12.4 billion • Employees: 10,500 • In 2003, PSEG celebrated its 100th anniversary. PSEG has paid a dividend annually since 1907 • PSEG is ranked 199 on the 2005 Fortune 500 list • Public Service Electric and Gas • Company • Electric customers: 2.1 million • Gas customers: 1.7 million • Service Territory: 2,600 sq. mi. • Other products and services: appliance repair business, relocation assistance programs, and energy conservation programs • Received the prestigious ReliabilityOne award for superior electric system reliability in mid-Atlantic region • PSEG Power LLC • Owned Capacity: more than 14,636 MW • Percent of PJM capacity: about 20% • An integrated regional electric trading floor • PSEG Energy Holdings • PSEG Global operates 25 generation plants primarily in North and South America • Total assets: more than $7.0 billion • Total Megawatts (MW) in operation: 3,000 MW net ownership • Total service area of distribution companies: 155,000 square miles
PSE&G Delivery Territory N W E . S o C x . e o s C s u c i S a s s a P . o C n e g r e B . o C n e r r a STATEN W ISLAND . o C s i r r o M . o C x e s . s o E C n o s d u H . . o o C C n n o i o n d U r e t n u H KEY: COMBINED ELECTRIC & GAS TERRITORIES ELECTRIC TERRITORY GAS TERRITORY . o C t e s r e m m o S . o C x e s e l d d i M . o C r e c r e M . o C h t u o m n o M . o C r e t s e c u o l G 0 10 ml 1 2 3 4 5 6 7 8 9 . o C n . a o e C c n O o t g n i l r u B . o C n e d m a C New Jersey • Public Service Electric and Gas Company is NJ’s oldest & largest regulated electric & gas delivery utility: • Traditional transmission and distribution utility • 150,000 miles of wire • 33,000 miles of pipe • 2,600 sq miles of service territory • 3.6 million customers • 2.1M electric customers • 1.7M gas customers • 2,600 sq miles in service territory (300 communities) • $7.6B in revenues • 6,100 employees • Four major unions • 24/7 operation
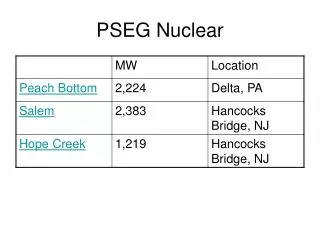
PSEG Power – Generating Assets NEW YORK MW Capacity EASTERN INTERFACE Albany CONNECTICUT <100 MW 100 - 500 MW Yards Creek 500 - 1,000 MW Keystone PENNSYLVANIA > 1,000 MW Conemaugh Mercer Burlington Peach Bottom National Park Bergen Salem Hudson Kearny Hope Creek MARYLAND Essex Bayonne Linden Sewaren VIRGINIA WEST VIRGINIA DELAWARE EASTERN INTERFACE Edison PJM West PJM The bulk of PSEG Power’s generation fleet is positioned to serve the most populated markets during times of transmission constraints
PSEG Power – Diversity and Scale 13,751 MW Operating Portfolio Fuel Diversity Market Segments Energy Produced (MWs) (MWs) (GWhrs) Nuclear Nuclear Baseload Oil Peaking 14 % 25 % 57 % 22 % 35 % Pumped Storage 1 % Pumped Storage 2% 18 % 41 % 30 % 12 % 43 % Coal Coal Gas Gas & Oil Load Following The majority of Power’s output is from low-cost nuclear and coal assets
PSE&G 2006 Reliability One Award- PSE&G named America’s most reliable electric utility for the second year in a row Best Electric Reliability Mid-Atlantic Region - 2001-2007 Best Electric Reliability in the Nation - 2005 and 2006 BSC Hall of Fame Award - 2007 Power 2006 INPO CEO Conference- Most Improved Nuclear Plants Award 2005 World Record –Refueling Outage with Reactor Head Replacement Duration 25 days 2006 Salem Unit 2 Best Ever Outage Duration 21 days Recent Events, Awards and Records
Phase 1 – Enterprise (PS, FICO) Completed 1/97 Phase 2 – Fossil Generation WM (PM) – Completed 1/98 Phase 3 – HR, MM – Completed 1/99 Nuclear Work Mgt. – Completed 6/99 Phase 4 – Transmission/Distribution Work Management (PSE&G) Electric and Gas Transmission and Fleet – Completed 12/99 Electric Distribution - Completed 9/02 Gas Distribution – Completed 3/03 Phase 5 – Portal, SEM, BW (yyyy) Phase 6 – GRC, xRPM, SSM, BPC Corporate SAP Initiatives
PSEG SAP Business Integration Journey Go Live CFO - PSEG COO - PSEG CIO – PSEG, Services Company SAP-COE Business Integration Team SAP Program Mgmt 1996 1997 1998 1999 2000 2001 2002 2003 2004 2005 2006 2007 2008 Enterprise Design Albany Plant Mid-West Plants Landscape on hold due to pending Merger Fossil Work Management Connecticut Plants HR Decoupled Corporate Business Processes CPI (SEM) Nuclear Work Management Utility CIS, CRM, Portal/UCES, MAM/MAU Utility Delivery WM Utility Inside Plant Quarterly Released-Based Management Program EAM 4.6 c EAM ECC 6.0 ERP / ERM 3.1h EAM 3.1h ERP 4.7 ERP 4.6b ERP ECC 6.0 EP 6.0, SEM 3.2, BW 3.01b EP,BI 7.0 Legend Exec Sponsor Support Org ERP/EAM ERP EAM
Organizational Design Production Support Methodology Landscape and Transport Management Product Management Process How we “Run” our systems
Infrastructure and Operations VP IT / CIO Organizing IT for Results Operational Excellence Business Solutions Architecture, Engineering, and Compliance Enabling Technologies Manage Run Improve Enable • Product Pricing • Product Billing • Strategy • LCP’s • Hosting • Production Support • Business Needs and Strategies • SAP COE • BI CC • Integration / Portal CC How ! What ??
Who do you want to be, an order taker, or a enabler of the future? Organizational – Learning’s • Best practice to have Business led implementations, but with IT participation • The IT support and development resources need to learn on the implementation • Seamless handover between project and support org is essential….formal knowledge transfer • Keep the momentum that the project created in order to drive increased usage in the long run, you cannot just go on to the next project • Be clear and concise or resource roles between the business, IT, and vendors. • If accountabilities for ongoing management are not in one organization, you still need single point of oversight and accountability to ensure tactical and strategic are balanced
Size for the core basics, outsource the peaks in the demand! Production Support – Learning’s • Outsourcing both Hosting and Production Support has reduced our TCO • Do not outsource your core skills (Business Process Knowledge) • SLA’s are key to a successful outsourcing • Manage outsourced resource turnover • Manage escalation from outsourced vendor to your internal staff (clear roles and accountabilities) • Manage and understand impact of application scale-out and additions upon your TCO • Manage “Changes” slipped in as “broke fix” to keep your cost low • Mine the help desk inventory for higher level process training opportunities • Ensure your COE knows what your users are doing / not doing
Stay Connected Landscape and Transport Management • As you add more current technology the more complex the landscape will get. • 14 three tier systems (Enterprise ,HR, BW, SEM, EP (2), xRPM, GRC, XI (2), SSM, BPC, CRM, MI • Do not underestimate the level of effort to keep in sync and at compatible support pack levels • Moving to HA and 12 hr DR for core systems • We use a dedicated landscape management team including transport oversight • Beginning use of Solution Manger and the “CHARM” process for seamless transport approval and processing • Routine schedule system maintenance window, max 8hr month. • Annually published schedule • key business stakeholder approval process for off normal shutdowns
Be relentless and consistent….Do not compromise the process Landscape and Transport Mgmt - Learnings • Monday Production Meeting (Hosting, Prod Support, COE) • Routine weekly transports • Normal, Wednesday afternoon • Quiet Period, Friday afternoon • Emergencies as needed (minimize) • Weekly integrated landscape management meeting • 12 week landscape look ahead • Spare / Sandbox instance request management • Development / Project status and landscape needs • Pre-approved transport “types” that do not require full integration review • Integrated Development / Broke Fix “Configuration Start” approval process • Continuous Improvement Process utilizing SAP Quality Notifications
In order to keep costs low, you need to know all your costs! Product Management Process • It is a balancing act to attain and maintain the lowest level TCO, while deploying new technologies / assets • While budgeting is done is separate towers, OPS, Engr, COE…..COE maintains overall cost picture • Product costs include • Annual maintenance fees • Hosting and Production Support outsourcing fees • Internal labor billed to the product • Depreciation and interest for Capital Product improvements • Billed to operating companies and Service Corp Practice areas using weighted average of HR Headcount and User ID Count • Allocation includes application / Module usage
Governance Model Architectural Strategies and Life Cycle Plans Development Process Foundational and Transformation Projects New Technology Introductions Reporting and Analytics Improving the applications and Enabling Further Business Process Performance
IT Governance Model Capital Review Committee IT Capital Investment Plan LOB IT Capital Investments LOB GovernanceCouncils CIO • IT Strategy & Roadmap • IT Service Offerings Investments to run, improve or enable the business Program Management Strategy Life Cycle Planning Enterprise Architecture Separate the what from the how ! Governance Process Decisions, based on business value, controlled by business leaders, will provide the foundation for sound investment decisions. Decision Model What Investment Funding,Pricing & Cost Recovery Decide how to fund investments, price services & recover their charges IT Supply Management Investment Prioritization& Value Realization Decide how much and where to invest and how to validate results Business-IT Principles Describe role of IT and business uses of IT How Investment Funding,Pricing & Cost Recovery Align information, technologies and IT services to business processes; optimize performances and capture synergies Investment Prioritization& Value Realization Describe the approach for securing and expanding the enterprise foundation IT Demand Management Business-IT Principles Deploy the IT resource for supporting IT strategy Business-IT governance involves six major decision types, divided across two high-level decision domains. Demand decisions are based on strategic business value while Supply decisions are guided by IT strategy and architecture that enables developing solutions the “Right Way”
Plan Technology Governance Approval Schedule and budget identified Tech. Council Review Governance Process- Initiative Planning Technology Councils Supply Chain Finance HR Utility Utility - Customer Power New Initiative Engage Tech. Council Client Plan
Round them up routinely! Governance Process- Technology Council SCM Technology Council
Architectural Strategies and Life Cycle Plans • Domain based 5 year LCP’s for core systems • Include support pack, HW and Software upgrade plans • Form the basis of the 5 year product price plan from an architectural perspective • Revised annually to reflect changes in and integrate with: • Changes in business direction, goals, and needs • Changes in developing, emerging, and maturing technologies
Focus on the value provided beyond the original request Development Process • Bundle enhancements (<$100k) into Quarterly releases. Presently on FR26 • Allows for gating of requirements, prioritization, and realization 4 times a year • Multiple go live windows during quarter • Leverages integrated testing • Facilitates integration of support packs and system maintenance needs • Levels work load • 4th Quarter SOX applications / controls freeze • Limit transports / configuration changes (soft freeze) during critical business periods (Nuclear Plant Refueling Outage) • Rigorous development and production acceptance process • KPI’s for “Right Work”, “Right Way”, and “Right Results”
Break the effort into manageable pieces! Foundational and Transformation Projects • Utilize discovery period prior to formal project start to reduce risk and identify unanticipated basis / hardware needs • If you have an older 3.x based security design, pay attention, test everything and be prepared for impact • Avoid bundling work, split out (early) as much as possible to control the risk • Gui upgrades • DB upgrades (Oracle) • HW upgrades
No pain, no gain….but be careful ! New Technology Introductions • Research and understand emerging technologies • Understand SAP’s on-boarding plan for newly acquired assets • Leverage your existing licensed applications when purchasing the targeted replacement platform with SAP • Do you want to be an early adopter / ramp-up customer or do you wait until the kinks are worked out • Be willing to us niche vendors to accelerate your implementation and knowledge transfer to your internal resources and support vendors • Be careful not to oversell what you can deliver to your customers until you really know exactly how the application works. Make sure the business requirement are CLEAR! • Will require additional PM oversight to ensure success
Listen, Listen, Listen………………..then start ! Reporting and Analytics • Determine what you client wants and give them what they need…. • Do they want a data mart to write their own reports? • Are there reports mature or dynamic? • Or do they want to automate what is routine to them? • Limit your toolset to keep development and support costs low • If you build it they will come….does not work! • Better user tools coming onboard …. BO, etc allows usability beyond BEX • BW/BI requires significant attention / intefacing with the ultimate end user to be successful
Listen, Listen, Listen………………..then start ! Who do you want to be, an order taker, or a enabler of the future? Size for the core basics, outsource the peaks in the demand! Be relentless and consistent….Do not compromise the process In order to keep costs low, you need to know all your costs! Separate the what from the how ! Round them up routinely! Focus on the value provided beyond the original request Break the effort into manageable pieces! No pain, no gain….but be careful ! Summary & Questions
Stephen Roche Public Service Enterprise Group