Download
1 / 15
150 likes | 305 Views
Mass Deficit of Glaciers at the Northern Antarctic Peninsula derived from Satellite-borne SAR and Altimeter Measurements. Helmut Rott 1,2 , Florian Müller 1 , Thomas Nagler 1 Dana Floricioiu 3 , Michael Eineder 3 1 ENVEO IT GmbH, Innsbruck, Austria

E N D
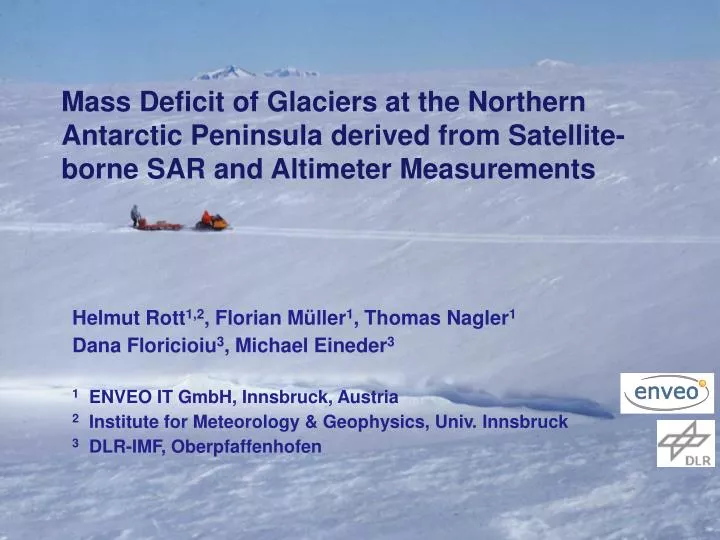
Mass Deficit of Glaciers at the Northern Antarctic Peninsula derived from Satellite-borne SAR and Altimeter Measurements Helmut Rott1,2, Florian Müller1, Thomas Nagler1 Dana Floricioiu3, Michael Eineder3 1 ENVEO IT GmbH, Innsbruck, Austria 2 Institute for Meteorology & Geophysics, Univ. Innsbruck 3 DLR-IMF, Oberpfaffenhofen
Contents of Presentation • The Scientific Question: Glacier contributions to sea level rise after ice shelf disintegration • Data sources and method • Overview on Collapse of Larsen-A and-B Ice Shelf • Example for acceleration of glaciers after collapse: Crane Glacier • Dynamic thinning by ICESat altimetry and mass continuity • The contribution to sea level rise
The Mass Balance of Grounded Ice is relevant for Sea Level Rise The main export of Antarctic ice is routed through ice shelves and lost by iceberg calving. BC The contribution to sea level rise is determined by the imbalance of net accumulation, BA, on grounded ice minus the export through a cross section at the grounding line or calving front, BC: BN = BA – BC • Satellite observations provide key input for computing BC: • The ice velocity at the cross section, v(y) • The surface elevation at the front (by altimetry, SAR) enabling to estimate ice thickness H
Investigation of Mass Imbalance of Glaciers • The Question: • The response and mass imbalance of glaciers after disintegration of northern LIS: Prince Gustav Channel (PCG), Larsen-A, Larsen-B • Data sources: • Precise maps of ice velocity for allglaciers: • - Pre-collapse ERS-1/ERS-2 tandem interferometry (1day repeat) 1995-99 • - TerraSAR-X (2m res.) incoherent amplitude correlation 2007-2010 • ICESat profiles (repeat pass) near grounding line for a few glaciers • Ice thickness of Crane Glacier: Bathymetry in fjord and airborne sounder (CReSIS, Univ. Kansas) 2002, 2004, 2009, 2010 (ambiguous signals) • Bathymetry in front of Crane Glacier 2006 (Zgur et al.) • Approach: • Compute fluxes across gate near 2008 ice front • Pre-collapse state of glaciers close to balance V(1999) = V(1995) • Pre-collapse net balance from flux Fy (1995,1999) • Post-collapse Fy refers to 2008-09, taking into account thinning
Larsen IS, AA ASAR WSM 22 March 07 Retreat of Grounded Ice after Ice Shelf Collapse Hektoria - Evans – Green Glacier H. Rott, T. Nagler
Deformation Pattern of Hektoria-Green-Evans Glaciers TerraSAR-X 28 March 2008 H. Rott, T. Nagler
Mass fluxes for glaciers in Larsen-B embaymentDrainage basins and calving gatesLandsatMarch 1986
TerraSAR-X Data Set for Ice Velocities of Larsen Glaciers • Method: • Motion mapping by incoherent amplitude correlation • Provides 2 components of velocity Vector • Requires persistent features • Does not require coherence • Accuracy < 5 cm/day (with 11- day repeat pass) • Apply multiple pairs: 11-, 22-, 33- , ….. days 70 Stripmap Scenes, June 2007 – Jan. 2010, 11-day repeat pass (multiple)
Ice Motion Retrieval – Example for Crane Glacier Frontal Velocity1995 1.7 m/d ERS InSAR 2007 7.2 m/d TerraSAR-X TerraSAR-X 18-29/10/2008 Decorrelates on fast glacier Amplitude correlation for V ERS Tandem 1995/10/31-1995/11/01 1 day repeat pass – good coherence
TerraSAR-X Velocity Profiles – Crane Glacier P1 P2 Profiles for computing calving flux (P1) and dynamic thinning (P2, P1).
Ice Thickness and Dynamic Thinning Surface lowering at P2observed by ICESat Flux divergence between 2 cross sections Surface lowering (mass continuity) 2008 1999 Cross section at P1, base extrapolated from bathymetry(Zgur et al., 2007)
Glaciers of Northern LIS – Contribution to Sea Level Rise Retreat of Grounded Ice since 1995 : Total 1995-2008 Decrease in Ice Shelf Area Northern LIS 1995-2007 13 000 km2 35 67 46 33 35 119 31 S-B Sjögren-Boydell D-B-E Dinsmoor-Bombardier-Edgeworth H-G-E Hektoria-Green-Evans Total Retreat of Grounded Ice Area 1995 -2008: 360 km2 Retreat of Grounded Ice March 2002 to 2008: 250 km² g 0.06 mm SLE (sea level equivalent, assuming 80 m height above buoyancy) Sea level equivalent contribution due to export at glacier fronts 2002 – 2008, Larsen A and B: 0.03 mm/a. Total SLE (2002-2008) 0.04 0.01 mm/a (ca. 3% of eustatic SLR)
The rapid disintegration of Northern Larsen Ice Shelf demonstrates the high sensitivity of polar ice masses to climate change – the retreat proceeding faster than predicted by models. • Repeat-pass SAR data offer unique capabilities to study flow dynamics of glaciers and ice streams with great detail. In synergy with precise surface topography (altimetry, TanDEM-X) mass balance can be retrieved. • The sea level contribution of the glaciers above Larsen-A and -B is not very significant, but the studies are important for predicting the dynamic response of large ice masses if warming spreads further south.