Download
1 / 17
170 likes | 314 Views
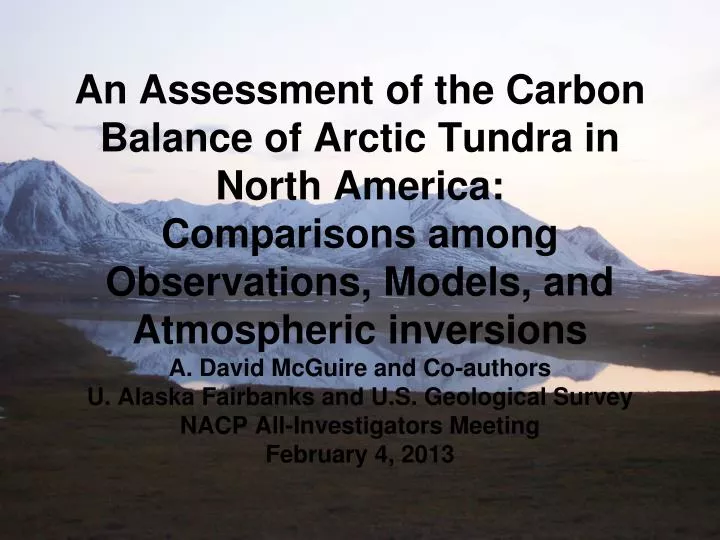
An Assessment of the Carbon Balance of Arctic Tundra in North America: Comparisons among Observations, Models, and Atmospheric inversions A. David McGuire and Co-authors U. Alaska Fairbanks and U.S. Geological Survey NACP All-Investigators Meeting February 4, 2013. Co-authors:

E N D
An Assessment of the Carbon Balance of Arctic Tundra in North America:Comparisons among Observations, Models, and Atmospheric inversionsA. David McGuire and Co-authorsU. Alaska Fairbanks and U.S. Geological SurveyNACP All-Investigators MeetingFebruary 4, 2013
Co-authors: • T.R. Christensen – Lund University, Sweden • Dan Hayes – Oak Ridge National Laboratory, USA • Arnaud Heroult – Lund University, Sweden • Eugenie Euskirchen – University of Alaska Fairbanks, USA • John Kimball – University of Montana, USA • Charles Koven – Lawrence Berkeley National Lab, USA • Peter Lafleur – Trent University, Canada • Paul Miller – Lund University, Sweden • Walt Oechel – San Diego State University, USA • Philippe Peylin – LSCE, France • Mathew Williams – University of Edinburgh, UK • Yonghong Yi – University of Montana, USA
Is the CO2sink of N. High Latitudes Changing? SOURCE SINK From Hayes et al. (2011, Global Biogeochemical Cycles)
Arctic Tundra Domain as defined by the Regional Carbon Cycle Assessment and Processes (RECCAP) Synthesis Activity McGuire et al. 2012. An assessment of the carbon balance of arctic tundra: Comparisons among observations, process models, and atmospheric inversions. Biogeosciences9: 3185-3204, doi:10.5194/bg-9-3185-2012.
Analysis of Observations (1990 – 2009) • Includes both chamber-based and tower-based studies • ~225 estimates of CO2 exchange tundra-wide • ~110 North America CO2 exchange estimates for tundra • ~152 estimates of CH4 exchange tundra-wide • ~45 North America CH4 exchange estimates for tundra
Synthesis of Tundra Observations • Annual exchange of CO2 cannot be distinguished from neutral balance • across the range of studies that have been conducted
Summary of Observationally Based Estimates of Mean Net CO2-C and CH4-C Exchange from Arctic Tundra to the Atmosphere (g C m-2 season-1) for Different Subregions Time Period North America North Atlantic Northern Europe Eurasia CO2 Exchange Summer Before 2000 -7 (521; -22 to 72) -32 (9; -58 to -5) -98 (4; -127 to -68) -25 (18; -50 to -1) Since 2000 -18 (28; -39 to 3) -53 (12; -90 to 16) -92 (5; -220 to 36) -73 (12; -141 to -4) Annual Before 2000 29 (9; 2 to 57) - -25 (6; -63 to -14) - Since 2000 -3 (14; -28 to 21) - -19 (33; -30 to -8) - CH4 Exchange Summer Before 2000 2.4 (10; 0.7 to 4.2) - 7.8 (13; 1.4 to 14.2) 3.0 (15; -0.4 to 6.5) Since 2000 1.4 (9; -0.2 to 2.9) - 12.5 (10; 1.9 to 23.0) 5.1 (29; 1.6 to 8.6) Annual Before 2000 4.4 (24; 1.4 to 7.4) - 15.0 (3; -18.3 to 48.3) - Since 2000 16.9 (2; -12.0 to 45.7) - 11.3 (27; 6.6 to 16.0) 8.2 (7; -1.8 to 18.1) 1Number of site-year estimates 295% confidence interval
Summary of Observationally Based Estimates of Mean Net CO2-C and CH4-C Exchange from Arctic Tundra to the Atmosphere (g C m-2 season-1) for Different Tundra Types Time Period Wet Tundra Dry/Mesic Tundra CO2 Exchange Summer -43 (451; -27 to -592) 5 (46; -11 to 21) Winter 31 (3; 1 to 61) 31 (7; 11 to 51) Annual -26 (27; -15 to -37) 10 (12; -27 to 47) CH4 Exchange Summer 9.2 (38; 5.4 to 13.0) 0.8 (25; 0.3 to 1.4) Annual 14.6 (22; 8.5 to 20.2) 2.3 (24; 0.3 to 4.3) 1Number of site-year estimates 295% confidence interval
Process-based Modeling • Regional Applications of Models: • - TEM6 – Permafrost, Vertical SOM, CH4, Fire • - LPJ-Guess WHyMe – Permafrost, CH4, Fire • - Orchidee – with Cryoturbation • - Terrestrial Carbon Flux (TCF) – Diagnostic Model • Global Applications of Trendy DGVMs: CLM4C, CLM4CN, • Hyland, LPJ, LPJ-Guess, Orchidee N, SDGVM, • Triffid • Compared two decades: 1990 – 1999 and 2000 - 2006 • Spatial domain defined by RECCAP Arctic Tundra mask
Mean NEE of Arctic Tundra Simulated by Process Models • NEE ranged between 0 and 34 g C m-2 yr-1 sink; sink increases between decades • 1 Results for North America
Changes in the Seasonal Cycle of NEP Estimated by the Regional Process Models • In the 2000s, LPJ-Guess WHyMe and Orchidee estimate greater uptake in early and mid-growing season, while TEM6 estimates greater uptake in the late growing season; lower NEP in October driven by greater RH during the 2000s in all models.
Atmospheric Inversion Modeling • 10 models • 1985 – 2009 depending on model • Spatial domain defined by RECCAP Arctic Tundra mask
Mean NEE of Arctic Tundra Estimated by Inversion Models • NEE ranged between 26 g C m-2 yr-1 source and 48 g C m-2 yr-1 sink • Sink increases between decades
Interannual Variability of Carbon Fluxes from Inversions • Interannual anomalies vary from 2.1 to 13.1 g C m-2 yr-1 (standard deviation) • Correlation of interannual anomalies is poor (mean r=0.03, range: -0.38 to 0.99)
Comparison of Regional NEE among Methods (Tg C yr-1) • Observations and Inversions – Can’t be distinguished from neutral balance • Process-Model Simulations – Arctic tundra has been a sink in the 1990s and 2000s • Only one central estimate is a source (observations in 1990s – North America) • All methods indicate that Arctic tundra has become a stronger sink in the 2000s
Comparison of Regional CH4 among Methods (Tg C yr-1) • Process-Model Simulations – tundra emissions are higher than observed estimates, • but not for North America. • Substantial overlap in uncertainties between observations and model estimates. • Both methods suggest that methane emissions increased from 1990s to 2000s.
Arctic Tundra C Assessment Conclusions • Estimates of NEE based on observations and inversions have large • uncertainties that cannot be distinguished from neutral balance, • except for observations of tundra in North America in 1990s. • Process models generally indicate that Arctic tundra acted as a sink • for CO2 in recent decades. • Central estimates based on observations, process-models, and • inversions each suggest stronger sinks for CO2 (except central • estimates of process-models for North America) and stronger • sources of CH4 in the 2000s vs. 1990s. • There is a need to reduce uncertainties from observations by better • stratification of observations between wet and dry/mesic tundra. • Simulation of the difference between production and decomposition • is important to improve in models for assessing responses of Arctic • tundra to projected climate change.