Download
1 / 8
80 likes | 287 Views
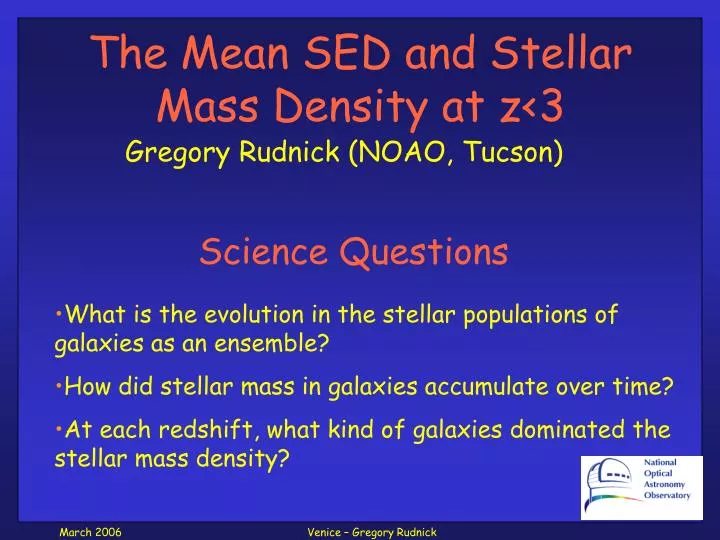
Science Questions. What is the evolution in the stellar populations of galaxies as an ensemble? How did stellar mass in galaxies accumulate over time? At each redshift, what kind of galaxies dominated the stellar mass density?. The Mean SED and Stellar Mass Density at z<3.

E N D
Science Questions • What is the evolution in the stellar populations of galaxies as an ensemble? • How did stellar mass in galaxies accumulate over time? • At each redshift, what kind of galaxies dominated the stellar mass density? The Mean SED and Stellar Mass Density at z<3 Gregory Rudnick (NOAO, Tucson) Venice – Gregory Rudnick
How to address Science Questions • A comprehensive census of all stars • Control field-to-field variance • Emphasize consistent comparison to theory Ivo Labbè, Natascha Förster Schreiber, Stijn Wuyts, and the FIRES team Venice – Gregory Rudnick
Redshift bins Rudnick et al. submitted to ApJ 4 fields with deep Optical/NIR data HDF-S MS1054-03 GOODS-S HDF-N Calculate luminosity density in complete region LV limit Venice – Gregory Rudnick
non-DRGs Split by J-K color DRGs are redder at all wavelengths DRGs Volume Averaged rest-frame SED of Luminous Galaxies Color of the Universe is consistent with morphologically normal nearby galaxies Venice – Gregory Rudnick
Modeling the Mean SED SSP CSF =300Myr Mean SED is well fit by simple models at all redshifts Strength of Breaks increasing with decreasing redshift redshift Venice – Gregory Rudnick
Observed *Evolution density increase by factor of ~10 from z=3 to 0 under the integral of SFR(z) (from UV) DRGs contribute significantly to stellar mass budget at 1.6<z<3 Still large field-to-field variations Venice – Gregory Rudnick
Comparison with Models Disagreement in relative evolution Are observations missing mass? Perform consistent comparison with models Model predictions are in poor agreement even when observational selection is applied Croton et al. 2005 Springel & Hernquist 2003 Finlator et al. 2006 Venice – Gregory Rudnick
Conclusions • Volume averaged SED evolves monotonically to redder colors from z = 3 to 0. • Mean SED at all redshifts is consistent with morphologically normal local galaxies. • Total mass density increases by ~10 from z = 3 to 0 • UV-selected samples miss more than 50% of mass in luminous galaxies • Consistently compared models fail to match observations. Venice – Gregory Rudnick