Download
1 / 149
1.49k likes | 1.69k Views
Network Management Tools Presentations. Saturday-Monday, Sept. 18-20, 2004, 6:30 PM CSE 552 – Network Management Fall 2004 (Term 041) Assignment 1. Schedule of Presentations. Network Management Tool with PRTG. What is PRTG. What PRTG can do for you. How PRTG works.

E N D
Network Management ToolsPresentations Saturday-Monday, Sept. 18-20, 2004, 6:30 PM CSE 552 – Network Management Fall 2004 (Term 041) Assignment 1
Network Management Tool with PRTG What is PRTG. What PRTG can do for you. How PRTG works. How to configure PRTG. 1. Add a new sensor. 2. Access Sensor Data. 3. Sensor Settings. 4. Setting PRTG Program Options.
Network Analyzer(WinDump) By Mohammed Aijaz Mohiuddin #230417
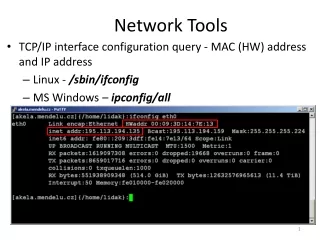
Brief Overview of Network Analyzer • It is GUI interface to command line tool windump(on windows). • Functions:- • 1) Capture and display network packets • 2) Display packets stored in a file • 3) Capture network statistics • 4) Perform real-time network monitoring • Requirement:- • WinPcap Driver. This driver allows most types of network cards to be placed in promiscuous mode. • Input:- user activity.
What more can be done…… Some of Many are as follows.. • Can capture the traffic of a specific host or specific subnet • Some PCs may have multiple interfaces. Traffic on a specific interface can also be obtained. • Incoming traffic to a host or Outgoing traffic from a host or Both can be captured. • Can store the result to a dump file for later purpose. • Thank you.
CyberGauge By Saeed Bawazir Abdullah Basalamah CSE 552 Network Management Tool
Agenda • Overview of CyberGauge Network Management Tool • Uses of the Tool and Examples • Conclusion
Overview • Windows-based Application Neon Software, Inc • Monitor switches, routers, hubs, servers…. Etc. • SNMP and MIB II • Automatically create: • utilization graphs • daily, weekly, and monthly quality of service (QoS), • Receive alerts for both non-responsive devices and traffic thresholds • Monitor 5, 10, 20 or 100 devices
How it works • sends an SNMP query over network to router's MIB • Several SNMP queries were sent to the router to compile a list of the network interfaces present on that router, along with each interface's maximum speed and its type. • another SNMP query was sent to obtain the router's name, type, location, how long the router had been running, and the person responsible for maintaining the router. • determine how much bandwidth was consumed during the Monitoring Rate interval, and calculates the percentage of the total bandwidth available
Uses of the Tool (Device Information) • CyberGauge Provides the troubleshooter: • Name, Type & Location of network device • Uptime • Number of interfaces.(useable/unuseable) • Party responsible for device
Uses of the Tool (Interface Information) • For each interface: • Interface name • VLAN • IP address • Type of network connection (Ethernet,..) • Max. speed (not actual) • Status
Uses of the Tool By CyberGauge: CCSE Primary Switch Device & Interfaces Information
Uses of the Tool (Performance Management) Monitor Network Connectivity: • Throughput • Link Utilization • Statistics Collection
Examples (CCSE – ITC) The IP address used: 196.1.65.253 Interfaces Statistics
Examples (CCSE – ITC) CyberGauge: IN/OUT Throughput for Up Link CCSE-ITC MRTG: IN/OUT Throughput for Up Link CCSE-ITC
Examples (CCSE – ITC) All Interfaces Can be Monitored
Examples (Local Company) IN/OUT Utilization for 128K Leased Line
Examples (Report Generation – CCSE Interface) • Report can also be generated as the device and interface is specified. • Sample Test for an interface in CCSE Switch: • Date Time IN (Kbps) OUT (Kbps) • 09/15/04 11:33:28 252.9 82.4 • 09/15/04 11:33:43 236.1 61.1 • 09/15/04 11:33:58 161.9 48.8 • 09/15/04 11:34:13 184.8 36.7 • 09/15/04 11:34:28 67.6 108.4 • 09/15/04 11:34:43 202.2 28.2 • 09/15/04 11:34:58 283.9 134.3 • 09/15/04 11:35:13 336.3 66.5 • 09/15/04 11:35:28 179.0 119.6 • 09/15/04 11:35:43 223.8 52.1 • 09/15/04 11:35:58 615.9 39.4
Conclusion • CyberGauge… • Utility for monitoring bandwidth information from any SNMP-based device • Answer critical questions: ·How much of my Internet bandwidth am I currently using? ·Are slowdowns in Internet access related to increased use of my Internet connection? ·Am I getting the bandwidth promised by my Internet Service Provider (ISP)?
MRTG Baher Al-Ramady 978504
OUTLINE • What is MRTG • How it works • How to use it. • Example 1 • Example 2.
Multi Router Traffic Grapher • Monitor the traffic load on network-links. • Open Source Code. Perl & C. • SNMPv1 & SNMPv2. • Visual representations of the traffic.
How MRTG Works • SNMP request. • Log the response. • File size does not increase. • Graph the polled data.
How to use it • IP, Community & OID. • SNMP Agent. • perl cfgmaker [options] [community@]router1 • cfgmaker public@10.221.0.65 • Make .cfg file. • Workdir: d:\inetpub\wwwroot\ • Interval: 5 • RunAsDaemon: Yes
Example 1 (Cat3550-335-1145 in 22-335-1 ) Standard Interface MIB
Example 2 1.3.6.1.2.1.31.1.1.1.6.index
Function • This VisualRoute Server provides a graphical traceroute from this server to any other network device you choose, useful for pinpointing network connectivity problems and identifying IP addresses. • VisualRoute Personal Edition combines essential networking utilities, including traceroute, ping, WHOIS, and reverse DNS, to determine precisely where and how traffic is flowing on an Internet connection, providing a geographical map of the route and the performance of each segment.
VisualRoute Features • See actual IP address locations - identifies the physical city/country location of IP addresses -- which is often quite different from the IP registration location -- and shows the path of an Internet connection on a global map. • Worldwide WHOIS reporting - get instant domain and network registration information from worldwide databases, so you can easily report a network problem or investigate an IP address.
VisualRoute Features • Internet connectivity analysis - answers the question "Why can't I get there from here?" by providing an analysis of the Internet from where you are to where you want to go. VisualRoute will help you to determine if a connectivity problem is due to your ISP, the Internet, or the host you are trying to reach, and pinpoints which network (ie. WorldCom, Verio, Ebone, MSN) a problem is in. • Automated ping reporting - the Ping Grapher tool continuously monitors the response time of a network host. • Application port testing - reports the availability of popular IP services including POP3, FTP and SMNP.