Download
1 / 13
130 likes | 263 Views
Vertical Distribution of Photosynthetic Pigments in Bamfield Inlet and Trevor Channel. Ashlee Lillis Eosc 473. Presentation Overview. Introduction to the Problem -Purpose of Study -Rationale Methods Results Conclusions/ Limitations of the Method. Purpose of Study.

E N D
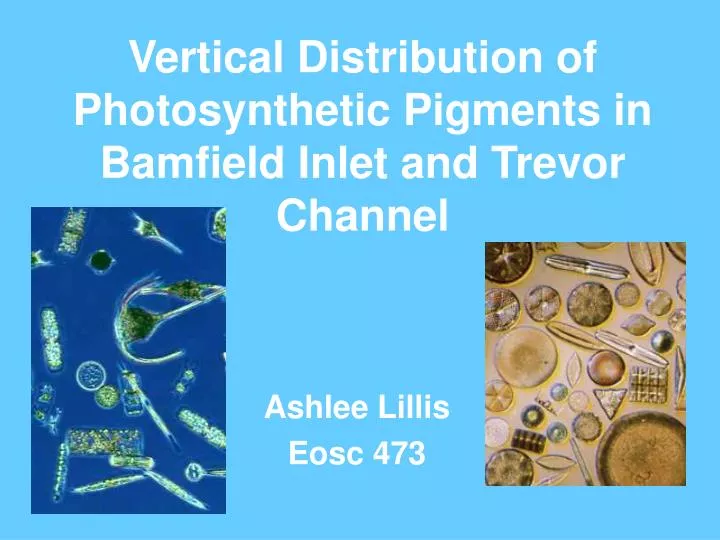
Vertical Distribution of Photosynthetic Pigments in Bamfield Inlet and Trevor Channel Ashlee Lillis Eosc 473
Presentation Overview • Introduction to the Problem -Purpose of Study -Rationale • Methods • Results • Conclusions/ Limitations of the Method
Purpose of Study • To investigate the relative distribution of photosynthetic pigments with depth WHY? - Light wavelengths are attenuated at different rates with depth in the ocean, and since the various photosynthetic pigments absorb at specific wavelengths (and phytoplankton have differential pigment composition), the vertical distribution of a pigment might be expected to reflect its absorption properties
Pigment Absorption Spectra • Chl a: Violet/ Indigo 400 - 460 nm Red 600 - 710 nm • Chl b: Blue 450 - 510 nm Red 620 - 680 nm • Chl c: Blue 450 - 500 nm • Carotenoids: Blue/Green 440 - 540 nm
Visible Light Absorption Spectra for the Open Ocean and Coastal Waters
Study Sites Trevor Channel Bamfield Inlet
Methods • At each site: -light meter readings taken -water sampled using bottles at 6 depths: 0, 5, 10, 15, 20, and 25 m • In the lab: - 100 mL of each sample retained for cell counts, the rest filtered - pigments extracted from filters for 24 hours in 90% acetone -absorbencies measured using spectrophotometer, converted to concentrations using formulas from literature -back at UBC, samples were settled and counts were made using an inverted microscope to estimate carbon concentrations based on equations for carbon equivalencies
Results: Light and Chlorophyll • Chlorophyll a maximum at 5 m, coincides with thermocline seen from CTD casts; minimum chl a at 10 m, perhaps due to high grazing? • Higher chl a at Trevor Channel site compared to Bamfield Inlet- greater light penetration?
Results: Pigment Depth Profiles • Relative pigment concentrations vary with depth, although no overall trend can be seen that relates to light quality for chlorophyll a, b, and c • At Trevor Channel site, chl b becoming relatively more important with depth, maybe due to blue light becoming more dominant
Carotenoid:Chl a Ratios • Carotenoid: Chl a ratio is highest at depth in Bamfield Inlet; perhaps green light in deeper water? • Why no carotenoids in Trevor Channel? Blue light more important?
Conclusions… • Light quality might have an effect on the ratio of pigments with depth, but the effect is not clear, and could be confounded by other factors influencing vertical phytoplankton distribution -it would be useful to be able to measure the light-types at the various depths to relate them better to the pigment analysis
Methodological Problems • Spectrophotometer 10x less sensitive compared to fluorometer • Using the spectrophotometric method, the detection limit is 0.2 mg/m3, very close to values obtained • Method depends on highly accurate wavelength settings • Amount of carotenoids can only be approximated because they are a mixture of compounds which may have different absorption coefficients • Phaeo-pigment detection using the spectrophotometer is contaminated by the presence of chlorophyll b and c since these are not corrected for by the equations; in my case, values for chl a after phaeo-pigment analysis were more… this doesn’t make sense! • Plant pigment analyses are more accurately (and expensively) carried out by high precision liquid chromatography Parsons, T.R., Maita, Y., and Lalli, C.M. 1984. A Manual of Chemical and Biological Methods for Seawater Analysis. Pergamon Press.