Download
1 / 19
230 likes | 396 Views
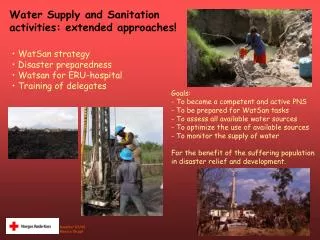
Performance Assessment System for Urban Water Supply and Sanitation. Meera Mehta, Dinesh Mehta and PAS team, CEPT University. Drinking water India. MDG target (85%) has been reached!. Population (millions). 874 1225. 227 367. 646 857.

E N D
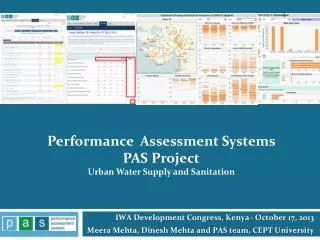
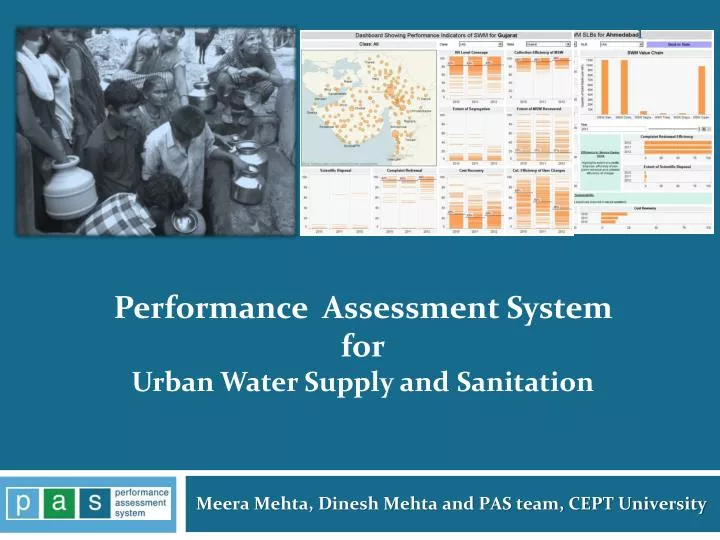
Performance Assessment System forUrban Water Supply and Sanitation Meera Mehta, Dinesh Mehta and PAS team, CEPT University
Drinking water India MDG target (85%) has been reached! Population (millions) 874 1225 227 367 646 857 Source: WHO/UNICEF Joint Monitoring Programme for Water Supply and Sanitation, (JMP) Media Round Table (27-3-2012)
Sanitation situation is worse in India Source: WHO/UNICEF Joint Monitoring Programme for Water Supply and Sanitation, (JMP) Media Round Table (27-3-2012)
Sanitation in India MDG target (69%) Will not be reached! 626 655 Population (millions) 874 1225 227 367 646 857 Source: WHO/UNICEF Joint Monitoring Programme for Water Supply and Sanitation, (JMP) Media Round Table (27-3-2012)
State progress to meet the Sanitation MDG India will reach MDG at this rate by 2054 only Source: WHO/UNICEF Joint Monitoring Programme for Water Supply and Sanitation, (JMP) Media Round Table (27-3-2012)
Waste water treatment Source: Water and Sanitation Programme (WSP), presentation at National Urban Water Awards, March 2014
Misallocated investments?? Total Investments … And YET………………… $2.54 Bn HOUSEHOLDS LACK ON-PREMISE LATRINE FACILITY 18.6% APPROVED COST FOR SEWERAGE PROJECTS JnNURM HOUSEHOLDS RESORTING TO OPEN DEFECATION 12.6% $161 Mn FUNDS ALLOCATED FOR SEWERAGE PROJECTS UIDSSMT $3.57 Bn HOUSEHOLDS LACK ON-PREMISE WATER SUPPLY FACILITY 8.1% APPROVED COST FOR WATER SUPPLY PROJECTS JnNURM 8.6% $281 Mn HOUSEHOLDS USING UNTREATED TAP WATER FUNDS ALLOCATED FOR WATER SUPPLY PROJECTS UIDSSMT Performance Assessment Systems Project in UWSS in India
Our Approach – benchmarking water and sanitation Complete lack of performance Measurement Performance Measurement With agreed key indicators against goals No monitoring by state and local governments Performance Monitoring at scale and at all levels: centre, state and local Use of technology for sustainability and scale Worsening urban water and sanitation service delivery Improved urban water and sanitation service delivery Set goals and priorities Influence policy and financing Service performance deteriorates over time Performance Improvement plans, tools and innovative financing Measure and monitor performance to reward and learn from success and demonstrate results
PAS Annual service delivery profile for 419 cities in 2States Performance Assessment System covering 32Key indicators and 90 local action indicators www.pas.org.in Water supply, waste water, solid waste management & storm water Old city area Newly developing colonies
Online data entry camps in state capitals PAS Project
Web based measurement and monitoring Shared data available at various levels Data entry: at city level Data storage: at state level State agencies, data and analysis Cities – data, results, analysis Citizens Access to analysis, results
Online Monitoring State profile of all SLBs Overview of all cities City profile of all SLBs Documentation of good practices
State level dashboard PAS Project
City level dashboard PAS Project
Key Lessons – 1 • Scale is critical to demonstrate importance of performance assessment systems • Working with governments is essential, but so is patience…..adequate time required to mainstream in government system – 5 to 7 years • Government ownership and regular reviews are essential • Once fully set up, PAS can be used for both outcome monitoring and rational investment decisions • Benchmarking exercise needs to be linked to performance based funding
Key Challenges • Need to strengthen delivery of water supply and sanitation • Lack of functioning bulk water meters • Consumer level water meters non-functional • Many Sewage treatment plants non-functional due to poor maintenance • on-site sanitation services poor • Meeting the financing gap for water and sanitation – low cost –no cost options • Linking performance measurement to service improvement is necessary to sustain interest of local governments
Thank You dineshmehta@cept.ac.in meeramehta@cept.ac.in www.pas.org.in Old city area Newly developing colonies