Download
1 / 1
10 likes | 101 Views
50. 50. 40. 40. Number of individuals. 30. 30. 20. Number of individuals. 20. 10. 10. 0. 2.0. 2.5. 3.0. 3.5. 4.0. 4.5. 5.0. 5.5. 6.0. 6.5. 7.0. 7.5. 8.0. Disease score. 0. 0. 5. 10. 15. 20. 25. 30. 35. 40. 45. 50. % survival. A ).

E N D
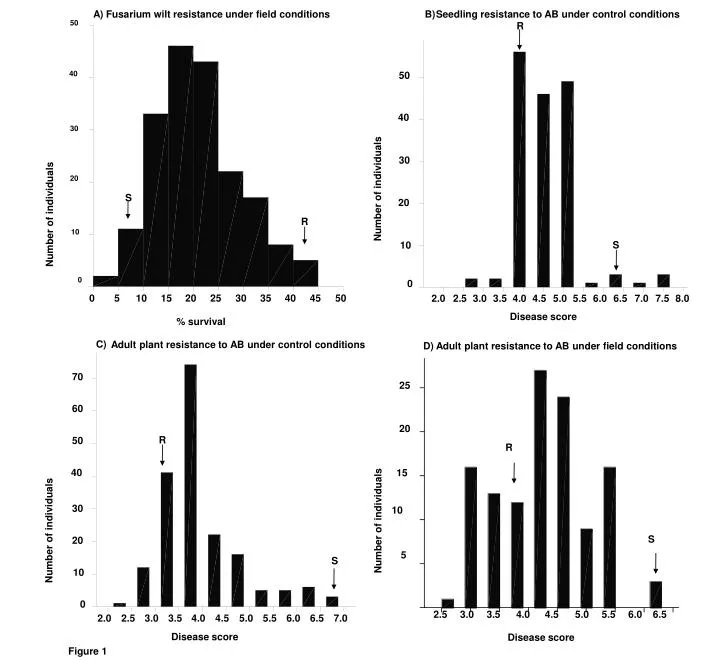
50 50 40 40 Number of individuals 30 30 20 Number of individuals 20 10 10 0 2.0 2.5 3.0 3.5 4.0 4.5 5.0 5.5 6.0 6.5 7.0 7.5 8.0 Disease score 0 0 5 10 15 20 25 30 35 40 45 50 % survival A) Fusarium wilt resistance under field conditions Seedling resistance to AB under control conditions B) R 70 25 60 20 S R 50 R 15 40 Number of individuals Number of individuals S 10 30 R S 20 5 S 10 0 2.5 3.0 3.5 4.0 4.5 5.0 5.5 6.0 6.5 2.0 2.5 3.0 3.5 4.0 4.5 5.0 5.5 6.0 6.5 7.0 Disease score Disease score Adult plant resistance to AB under control conditions Adult plant resistance to AB under field conditions C) D) Figure 1